Energy & Emissions
We are demonstrating leadership in the transition to a low-carbon economy within the industry and beyond.
Our approach
The emission of greenhouse gases (GHG), which are generated through the burning of fossil fuels, is one of today’s biggest challenges. Every business, government, and individual has a role to play in meeting the goals of the Paris Agreement. We understand the risks posed by climate change, and we are taking action to reduce our energy consumption and related emissions to strive for a low-carbon economy. We use the latest scientific knowledge to guide a sound management approach, and our emission reduction targets have been validated by the Science Based Targets initiative (SBTi).
Our energy consumption and GHG emission reduction program is part of our global Environment Directive. Furthermore, our Environment, Health & Safety, and Sustainable Products Expert Groups are developing and implementing initiatives to achieve the related targets. One such target is the establishment of energy management systems at our manufacturing sites that account for 85% of all on-site energy consumption. As of 30 June 2024, 61% of our sites in scope (18 sites) have established energy management systems.
Our contribution to the fight against climate change
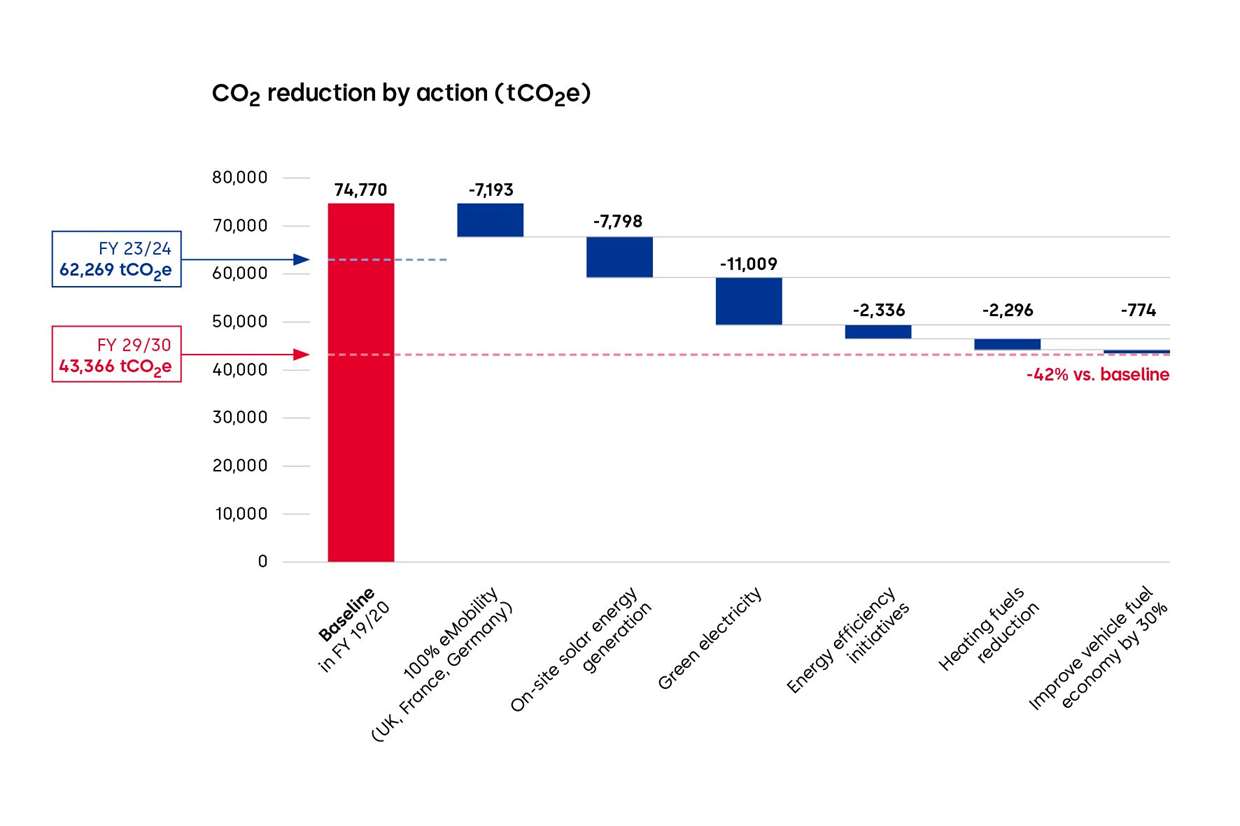
In 2021, the SBTi approved our targets for operational and value chain emissions. We aim to reduce operational (Scope 1+2) emissions by at least 42% in line with a 1.5°C future by 2030, without the use of carbon offsets (baseline 74,770 tCO2e in FY 19/20). We are currently on track with our annual reduction targets and have reduced emissions by 17% versus our baseline. Any residual emissions will be voluntarily compensated through Gold Standard offsets to achieve our target of becoming carbon neutral by 2030. Progress against the operational emissions target is being tracked as part of our sustainability-linked credit facility.
Many components used to create our products are manufactured in-house through processes including melting, aluminum and zinc die casting, machining, purchased parts processing, and final assembly. The aforementioned processes also require controlled, HVAC-conditioned space for process control, labor efficiency, and maintenance of a healthy working environment. Together, these processes drive our total energy demand. As a result, we are focusing many of our energy-saving initiatives in this area. In line with our science-based emission reduction targets, we aim to reduce the energy intensity of our operations by 25% by 2030 (baseline 100.5 MWh/mCHF in FY 19/20).
We also aim to reduce our value chain emissions (Scope 3) from purchased goods and services, and the use of sold products by 25% by 2030 (baseline 734,850 tCO2e in FY 19/20).
To achieve our ambitious targets, we are focusing on the following activities:
- Investing in energy efficiency projects
- Increasing on-site production of solar power
- Purchasing electricity from renewable sources
- Electrifying our fleet
- Improving the energy efficiency of our products in the use phase
Our climate transition plan
We are opening the doors wide to a low-carbon economy. In fact, we aim to be net zero by 2050 at the latest. Let’s look closer at our near-term Scope 1+2 targets.
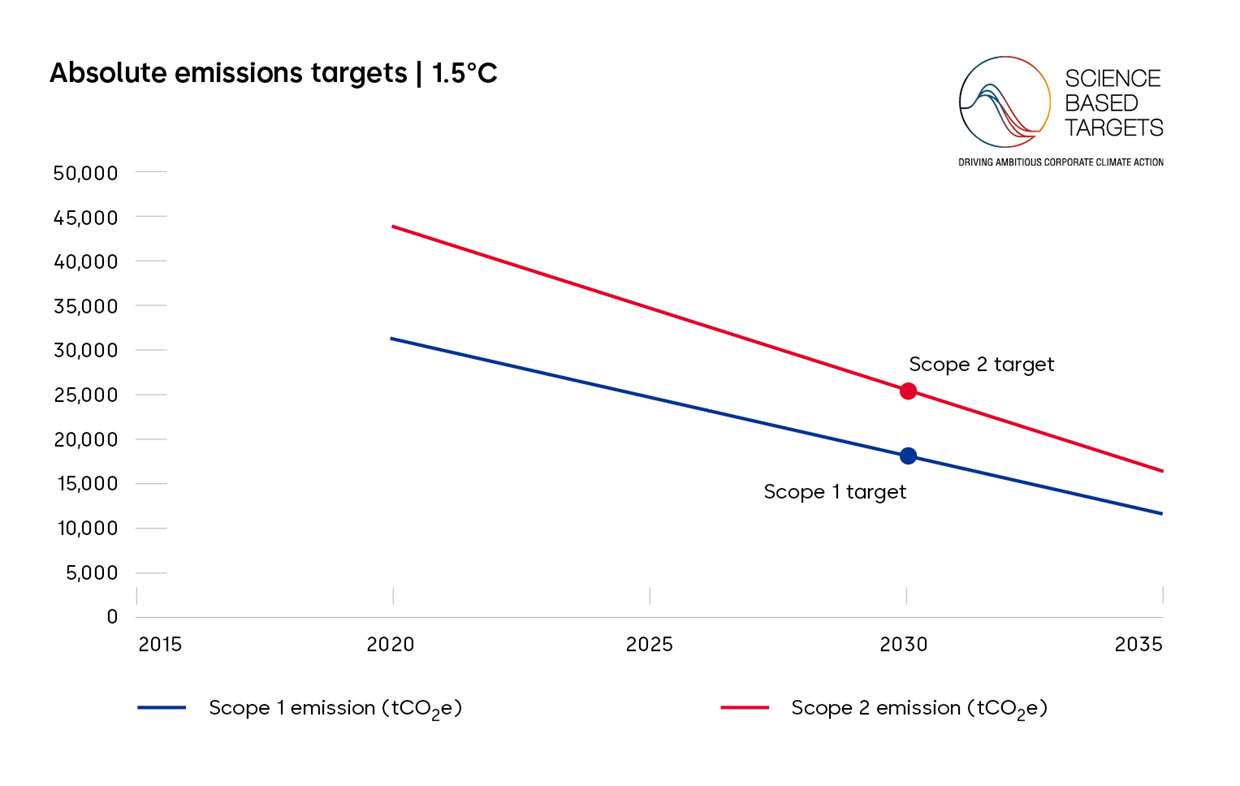
Absolute emissions targets: Scope 1+2
As approved by the Science Based Targets initiative (SBTi), our target is to reduce absolute Scope 1+2 greenhouse gas (GHG) emissions by 42% by 2030. This means total emissions savings of 31,403 tCO2e versus the baseline.
Our strategy
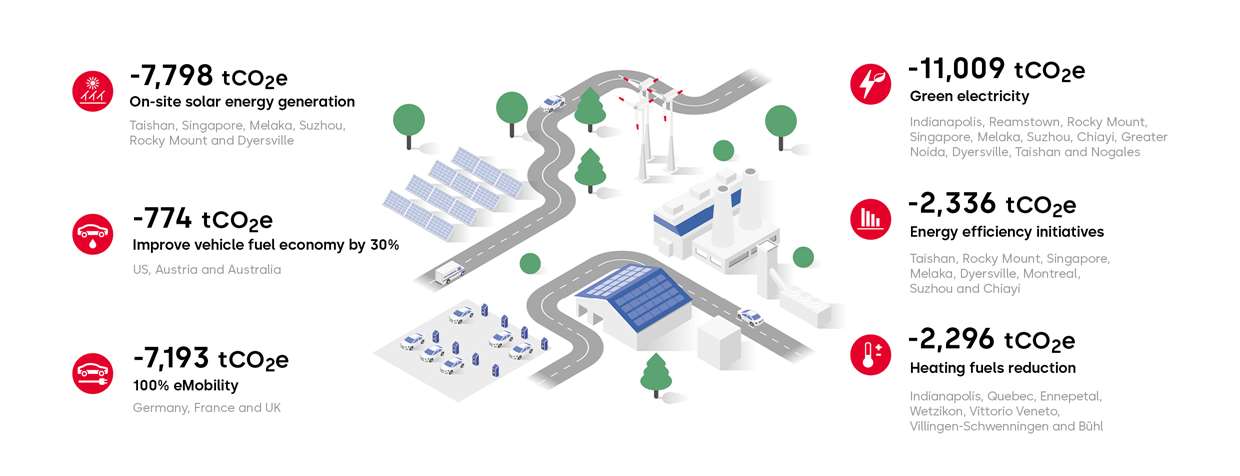
To achieve the 42% reduction (31,403 tCO2e), we have set Must-Have initiatives along six levers, that must be completed by 2030. These initiatives are executed at dormakaba sites, where we can have the largest impact on reducing our CO2 emissions. We are on track with our climate action plan and already achieved a 17% reduction since the baseline in FY 19/20.
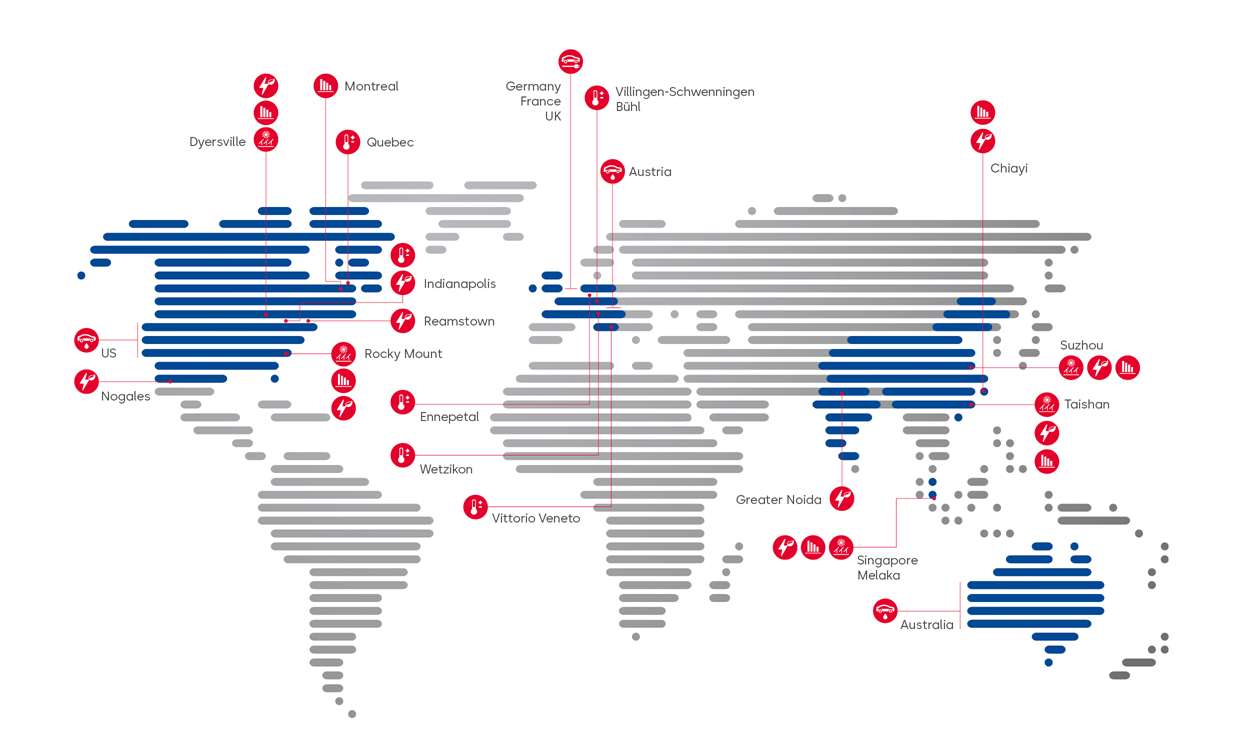
dormakaba locations around the world with Must-Have initiatives
We welcome stakeholder feedback, questions, or suggestions related to our climate transition plan. Should you like to share your opinion, kindly send an email to sustainability@dormakaba.com.
Our performance
Greenhouse gas emissions
In FY 23/24, our total greenhouse gas (GHG) emissions (Scope 1+2) amounted to around 62,300 tCO2e. More than 52% were emitted as a consequence of electricity consumption, followed by vehicle and heating fuel consumption, volatile and process gas emissions. Climate-related initiatives implemented during the reporting year resulted in total annual savings of approximately 21,500 tCO2e (over a third of our total footprint from own operations).
Thanks to the implementation of the energy-saving initiatives outlined in the next section, we expect to reduce our annual GHG emissions by approximately 400 tCO2e. We have worked diligently to source renewable electricity or generate our own renewable energy where feasible, leading to annual emissions avoidance of approximately 21,100 tCO2e. In addition, we have expanded the production of on-site solar energy by more than five times.
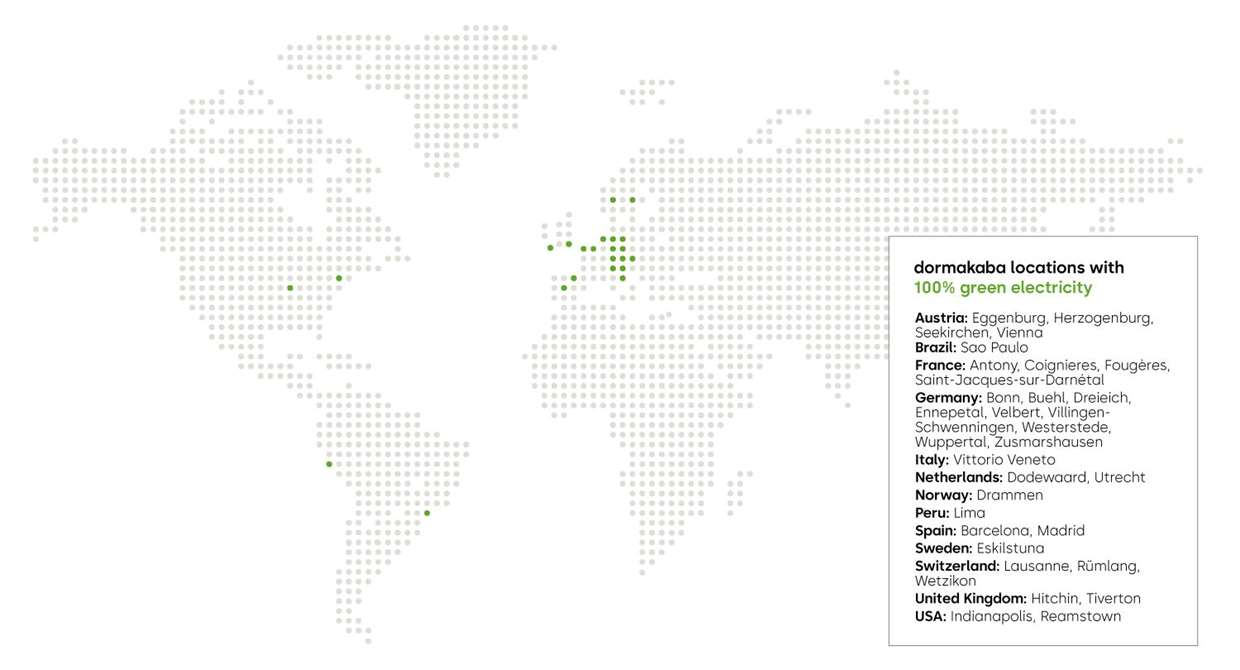
63,715 MWh (53%) of the electricity that we consumed or generated came from renewable sources. 31% of the locations covered in this report, purchased 100% green electricity in FY 23/24.
dormakaba locations purchasing 100% green electricity
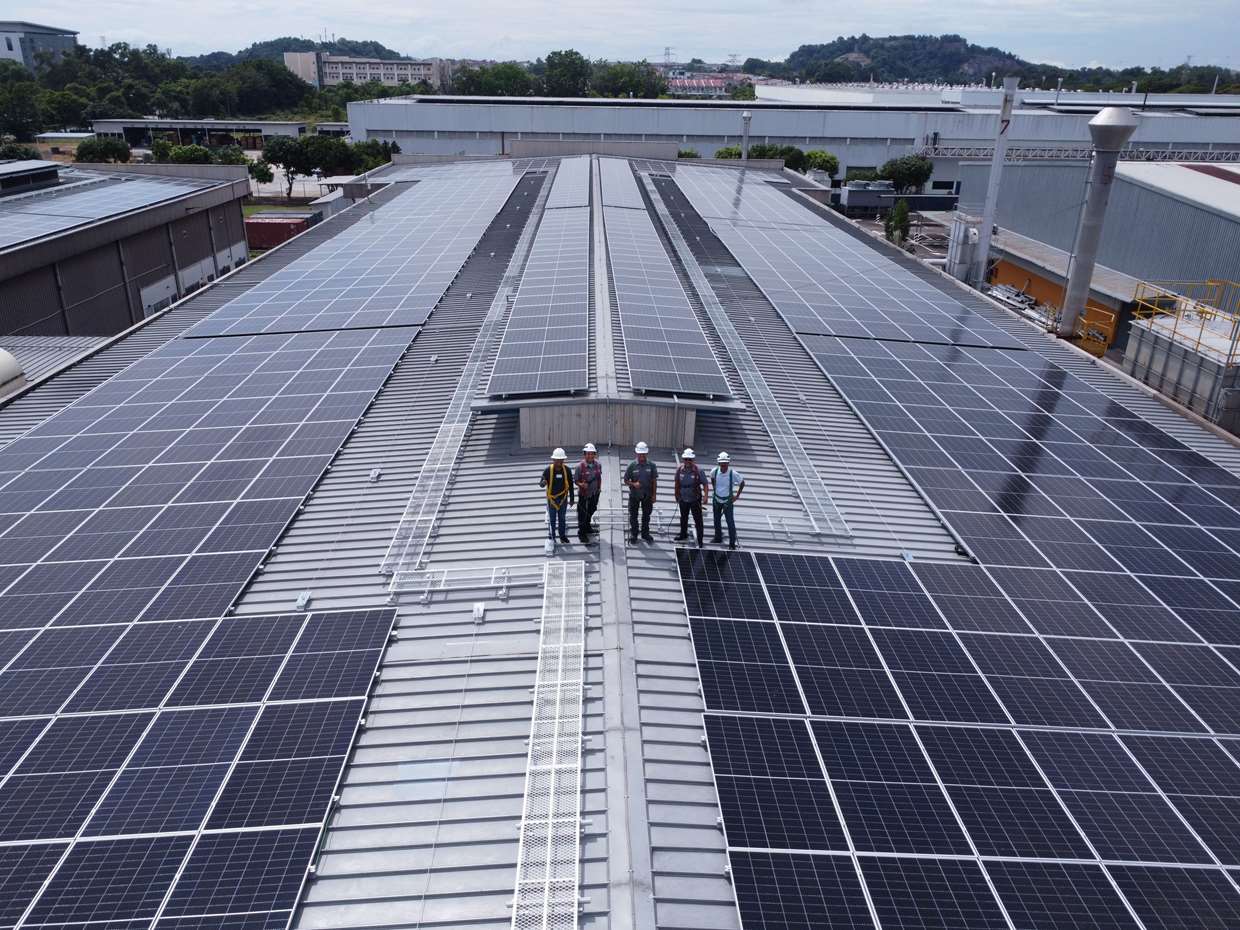
Commissioning of 21,000 solar panels at three production sites
During FY 23/24 we significantly increased the generation of solar energy at our sites. We started operating three photovoltaic power plants with a total of 21,000 solar panels on the roofs of our production sites in Melaka (Malaysia), Suzhou (China), and Taishan (China). The solar installations are expected to produce more than 11,000 megawatt hours (MWh) of electricity and to save almost 7,000 tons of CO2e annually.
Key data of the solar energy projects:
- Melaka (Malaysia): 1,020 solar panels, expected annual production of 826 MWh, and savings of 540 tCO2e
- Suzhou (China): 2,258 solar panels, expected annual production of 1,216 MWh, and savings of 762 tCO2e
- Taishan (China): 17,675 solar panels, expected annual production of 9,050 MWh, and savings of 5,671 tCO2e
The commissioning of the solar panels is a significant step towards achieving our CO2 emission reduction target and contributing to the transition to a low-carbon economy. This measure is both ecologically beneficial and makes economic sense due to the expected high carbon price in the future. These on-site solar panel installations contribute to 25% of the total savings planned in our climate transition plan.
Greenhouse gas emissions by source (tCO2e)

Scope 1 and Scope 2 greenhouse gas emissions (tCO2e)1

- Greenhouse gas inventory calculated in accordance with the WRI/WBCSD Greenhouse Gas Protocol. Emission factor sources: UK Defra (2019), US EPA eGRID (2018), IEA (2019), AIB (2018).
- Scope 1: direct greenhouse gas emissions from sources owned or controlled by dormakaba.
- Scope 2: indirect greenhouse gas emissions from sources owned or controlled by another entity, as a consequence of the company’s activities.
- Biogenic emissions associated with the combustion of biofuel amount to 74 tCO2e. These are called “outside of scopes” emissions and reflect the impact of burning biomass and biofuels. The fuel source itself absorbs an equivalent amount of CO2 during the growth phase to that released through combustion.
- The greenhouse gas emissions associated with electricity consumption are reported according to the “market-based approach”, as defined in the Greenhouse Gas Protocol Scope 2 Guidance.
Year-on-year absolute Scope 1+2 emissions (tCO2e)

Scope 3 emissions constitute around 90% of our combined Scope 1, 2, and 3 carbon emissions, highlighting the importance of Scope 3 emissions for our climate strategy. While setting our baselines, we carried out screening across all relevant Scope 3 emissions categories, which showed that the largest sources of Scope 3 emissions are purchased goods and services (75%) and the use phase of sold products (11%). This is why we have set our SBTi targets based on these two categories.
Scope 3 emissions: purchased goods and services (tCO2e)1, 2

Scope 3 emissions: use phase of products (tCO2e)3

Year-on-year absolute Scope 3 emissions (tCO2e)

In FY 23/24 we improved our Scope 3 reporting processes and included five new categories in our ESG Performance table for the first time.
For the second year in a row, we saw reductions in emissions stemming from the use of sold products. However, emissions from purchased goods and services continued to increase. Currently, data is collected on a material type basis, rather than disaggregating to an individual supplier level. This means we have little leverage to encourage suppliers to decarbonize. To address this, in FY 24/25 we will start to collect primary CO2 data from our most carbon intensive suppliers and collaborate with them on their reduction strategies.
Innovation for a low-carbon economy
When it comes to primary energy consumption, the building sector is one of the largest energy users in the world – as a result, its influence on climate change is enormous. We have therefore set a target of having best in class energy efficiency for new products, which we have achieved last year. Our digital Product CO2 Inventory Tool has been supporting us in this as it provides information on the carbon emissions of energy-consuming products during their use phase (the calculation method is in line with the GHG Protocol). The tool includes the footprint of around 350 products that consume energy after installation, including those that are battery-operated or connected to the electricity grid. This supports product development and optimization activities to create more energy-efficient products and also contributes to our target of decreasing Scope 3 emissions from the use phase of sold products.
We also offer two further sustainable solutions: our Motion IQ, which is an intelligent sensor system for automatic doors, and our Door Efficiency Calculator, which is a tool that helps customers choose the most energy-efficient entrance solution for their building.
Our MotionIQ system ensures that automatic doors only open when they really need to and for no longer than necessary. This means the doors move less frequently, therefore reducing air exchange with the outside and minimizing the amount of energy needed for heating or cooling indoor air. Using the MotionIQ system together with swing door operators typically saves 50% of energy versus without. Additionally, the service life of the drive technology is extended, as unnecessary openings are avoided.
Our Door Efficiency Calculator makes it possible to compare and analyze different automatic doors in terms of their impact on a buildingʼs airflow, energy use, and CO2 emissions, depending on factors such as building type, usage, and typical weather conditions for the site. This tool provides our customers with a valuable decision-making aid for selecting the best solution that also meets the requirements of the building in question.
Energy consumption
Our total energy consumption for FY 23/24 was over 240,700 MWh. Electricity and fuels for heating or manufacturing constitute nearly 73% of total energy consumption and play a crucial role in our production processes. Fuel consumption of our vehicle fleet makes up the remaining energy consumption.
Energy-saving initiatives were implemented at various sites. This work included upgrading equipment such as air compressors, the optimization of heating and cooling systems, and improving fuel efficiency.
Below are some specific examples of activities from our facilities across the world in FY 23/24:
- In Indianapolis (USA) we have replaced two old HVAC units that contributed to a large portion of the CO2 emissions of the facility. Additionally, new replacement energy recovery units were installed that help recover waste heat generated by the air-conditioning units. Monitoring of savings is still ongoing.
- In addition to the solar panel installations in Suzhou (China) and Melaka (Malaysia), the optimization of the air compressors led to further energy savings. In Suzhou the compressed air usage of a thinner recycling machine was reduced, resulting in an estimated annual saving of 107 MWh or 67 tCO2e. And in Melaka, we expect annual savings of 318 MWh or 207 tCO2e after replacing an inverter air compressor, installing an optimizer controller to efficiently run the three compressors, installing an additional air receiver tank, and resizing the piping system.
- To improve the heating fuel efficiency, in Villingen-Schwenningen (Germany) we have monthly workshops where we look at the consumption values and optimize the heating phases accordingly in order to operate the heating as efficiently as possible. At 773 MWh we have stayed well below our target consumption of 1,000 MWh.
- To reduce the use of vehicle fuels, we have trained 30 of our drivers in Columbia on fuel-efficient driving methods. Furthermore, with four new electric vehicles purchased in FY 23/24, the Austrian fleet now has 30 electric vehicles, making up about the 30% its total fleet.
As a result of these and other activities, we realized total quantifiable annual energy savings of more than 700 MWh for the sites covered within the scope of this report.
Energy use (in MWh)

Electricity by source (in %)

EU Taxonomy
The EU taxonomy allows financial and non-financial companies to share a common definition of economic activities that can be considered environmentally sustainable, in recognition of the fact that the shift of capital flows towards more sustainable activities has to be underpinned by a shared, holistic understanding of the environmental sustainability of activities and investments.
Based on the EU taxonomy technical screening criteria, a company’s internal economic activities can be classified according to their environmental sustainability. The classification system is broken down into six environmental objectives:
- Climate change mitigation
- Climate change adaptation
- Transition to a circular economy
- Pollution prevention and control
- Protection and restoration of biodiversity and ecosystems
- Sustainable use and protection of water and marine resources
Economic activities that have the potential to contribute to one of the environmental objectives are referred to as taxonomy-eligible. Those taxonomy-eligible activities that are actually environmentally sustainable are referred to as taxonomy-aligned. Taxonomy alignment requires fulfillment of the following three criteria sets:
- Substantial contribution to one of the six environmental objectives
- No significant harm regarding the other five environmental objectives (Do No Significant Harm, DNSH)
- Compliance with minimum social and governance requirements (minimum safeguards)
Articles 3 and 9 of Taxonomy Regulation (EU) 2020/852 (Taxonomy) require dormakaba to disclose sales, capital expenditure (CapEx), and operating expenditure (OpEx) related to environmentally sustainable economic activities. In this reporting year, taxonomy eligibility must be reported for all six objectives. Additionally, as in the last financial year, we also meet our requirements to report on both taxonomy eligibility and alignment for the first two environmental objectives, climate change mitigation and climate change adaptation.
After thorough examination of Technical Annex 1 of the Taxonomy Regulation (EU) 2020/852, and the Commission Delegated Regulation (EU) 2023/2486, we have found that only a few of our revenue-generating activities are taxonomy-eligible regarding climate change adaptation and mitigation. We conducted this review against the full scope of our products and solutions together with the Product Sustainability department and Product Managers. It was found that the EU taxonomy classification is largely not applicable to the majority of our revenue-generating activities – nor to that of the access solutions industry in general. On the other hand, greater alignment on eligibility can be seen in the area of the circular economy. There was no eligibility found at this time regarding the environmental objectives of pollution prevention and control, protection and restoration of biodiversity and ecosystems, and sustainable use and protection of water and marine resources. However, we will reevaluate this on a regular basis.
You can find the company’s eligible activities related to revenue listed in the table below.
|
Objective |
|
Economic activity |
|
Taxonomy-eligible activities |
|
Climate Change Adaptation and Mitigation |
|
3.5. Manufacture of energy efficiency equipment for buildings |
|
Manufacture of doors that could be installed as external doors with U-value lower than or equal to 1.2 W/m 2 K* |
|
Substantial contribution to the transition to a circular economy |
|
1.2. Manufacture of electrical and electronic equipment |
|
All new electrical products include the circularity approach |
|
|
|
4.1. Provision of IT/OT data-driven solutions |
|
We develop, install, deploy, maintain, repair, and provide professional services related to operational technologies for some of our products. |
|
|
|
5.2. Sale of spare parts |
|
We sell spare parts to maintain the functionality of the product. |
* Taxonomy Report 2020/852 Technical Annex 1, section 3.5. Manufacture of energy efficiency equipment for buildings; relating to “doors with U-value lower or equal to 1.2 W/m 2 K”. Revenues from all doors that could be installed as external doors were therefore defined as eligible. Product management then reported the U-values for all such doors to determine taxonomy alignment.
Cross-cutting activities to which only capital and operating expenditures are attributed were also considered, such as solar PV projects, electric vehicle charging installations, and energy efficiency initiatives. Eligible activities can be found below.
|
Objective |
|
Economic activity |
|
Taxonomy-eligible activities |
|
Climate Change Adaptation and Mitigation |
|
4.1 Electricity generation using solar photovoltaic technology |
|
Installation and operation of solar panels on the rooftops of our manufacturing sites, such as in Melaka (Malaysia), Suzhou (China), and Taishan (China) in FY 23/24 |
|
|
|
7.3 Installation, maintenance, and repair of energy efficiency equipment |
|
Installation of new air compressors or other energy-consuming equipment |
|
|
|
7.4 Installation, maintenance, and repair of charging stations for electric vehicles in buildings (and parking spaces attached to buildings) |
|
Construction and maintenance of EV charging stations |
A summary of the results for FY 23/24 can be found below. The investment and spend values related to CapEx and OpEx were taken into account only for those initiatives that are eligible and/or aligned and that are tracked and controlled in our global Sustainability Initiatives tracker tool to ensure against double counting. A due diligence assessment against the minimum safeguards and DNSH criteria was undertaken by our Human Rights function. The detailed breakdown by environmental objective related to turnover and CapEx can be found in the Indices section of this report.
|
|
|
Taxonomy-aligned |
|
Taxonomy-eligible but not aligned |
|
Taxonomy-eligible |
|
Taxonomy non-eligible |
|
Turnover 1 |
|
0.2% |
|
36.14% |
|
36.3% |
|
63.7% |
|
CapEx 2 |
|
1.2% |
|
0.0% |
|
1.2% |
|
98.8% |
|
OpEx 3 |
|
0.0% |
|
0.0% |
|
0.2% |
|
100.0% |
1 Turnover (eligible): Net sales from external doors, software, spare parts, electronic products. For the latter three, alignment was not assessed and therefore categorized as not aligned. Turnover (aligned): Net sales from doors with a thermal efficiency U-value of less than or equal to 1.2 W/m 2 K
2 CapEx includes: CapEx for generation of renewable energy (e.g., solar power installations); CapEx for energy efficiency initiatives; CapEx for electric vehicle charging points, plug-in hybrids, and full-electric vehicles in the fleet
3 OpEx includes: OpEx for energy efficiency projects
Outlook
In FY 24/25, the top 85% of our most energy-intensive manufacturing sites will continue to set up energy management systems. We will also continue facility improvement measures to reduce our operational carbon emissions in eight plants, primarily in the Americas and APAC. For example, we will install more efficient air conditioners, chillers, compressors, and heat recovery technologies. And are also installing 66 EV charging stations in Germany and upgrading a large portion of our fleet in Australia to hybrid. In total, we expect to save around 2,300 tCO2e through these investments.