Notes to the consolidated financial statements for the financial year 2022/23
1. Performance
This section provides information on the operational performance of dormakaba Group and the current operating model, the outlook on the organizational changes and its implication on the operating model, as well as on the future segment disclosure. The description of the operating model provides useful information to understand the segment reporting, which corresponds to the Group's internal reporting system. In addition, information is presented on selected income and expense items.
The key headlines concerning the Group's performance are:
- Net sales of CHF 2,848.8 million, growth of 3.3%
- Organic sales growth of 8.4%
- Adjusted EBITDA increased by 3.4% to CHF 384.8 million with an adjusted EBITDA margin of 13.5%
- Net profit of CHF 88.5 million
- Operating cash flow margin increased to 10.1%
- Dividend proposal of CHF 9.50 per share
1.1 Segment reporting
Operating model until 30 June 2023
The Access Solutions (AS) business is divided into three customer-centric regional sales organizations – Americas, Asia Pacific, and Europe & Africa. These three Regions are supported by Global Functions to secure efficiencies of scale and to capture business synergies in product development, product management, and operations. To enable a strong customer focus and sales generation, the three Regions are built around:
- Project and solutions sales, focusing on architects, design engineers, and influencers to increase specification capabilities
- Indirect sales, focusing on distributors, general contractors, and project managers to enhance a dedicated offering for key verticals and to push cross-selling
- Services, focusing on facility managers, building operators, or installers to support services growth as part of the company’s global core business
Key & Wall Solutions completes the organizational setup as a standalone global segment.
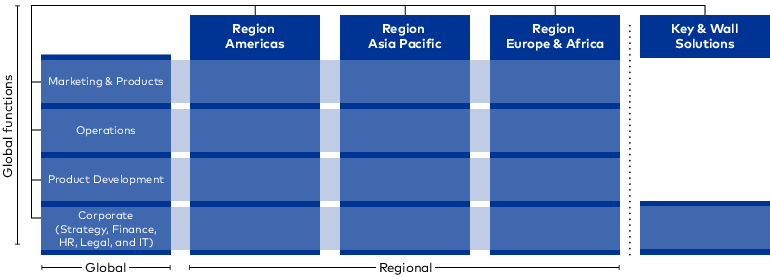
Region Asia Pacific covers the Markets ASEAN, Greater China, India, Pacific & North Asia, and the Middle East. The Region Asia Pacific includes two OEM (Original Equipment Manufacturer) plants situated in mainland China and Taiwan.
Region Europe & Africa covers the Markets Austria, Germany, Switzerland, CEERT (Central and South East Europe, Poland, Russia, and Turkey), Scanbalt (Sweden, Norway, Denmark, Finland, and the Baltic states), South (Belgium, Luxembourg, France, Spain, Portugal, Italy, and French-speaking Africa), UK, Ireland, Netherlands, and the Sub-Sahara.
Key & Wall Solutions operates as a standalone self-contained segment with two global businesses – Key Systems and Movable Walls. Key & Wall Solutions includes its productions facilities, which are situated around the globe in North and South America, Europe, and Asia.
Marketing & Products manages the entire product & solution portfolio lifecycles globally to support and develop sales units to achieve market success. In addition, it is responsible for creating an engaging customer journey along the sales funnel from strategic marketing through branding and marketing communication to strategic pricing and sales excellence.
Operations is responsible for dormakaba’s entire production network including the areas Plants, Manufacturing Excellence, Industrial Engineering, Procurement, Logistics, and Health & Safety. Operations’ main task is to build an integrated production network, optimize the production footprint, bundling our purchasing activities, and drive lean efforts.
Product Development is responsible for delivering customer- and market-oriented product and solution developments and innovations. In cooperation with Marketing & Products, it develops and steers innovations and technology strategies to foster dormakaba’s innovation leadership in the market.
Corporate functions (Finance, HR, IT, Legal, and Strategy) globally support the above Regions and Functions to steer the business, drive implementation of the current Shape4Growth strategy, and strengthen customer-centricity of dormakaba.
In accordance with the management organization, the reporting to Group management consists of the three regions, Key & Wall Solutions, and the Global Functions, as described above. Segment reporting is prepared up to the level of adjusted EBITDA/EBIT because these are the key figures used for management purposes. The reporting forms the basis for assessing performance and allocating resources. Financial transactions of Global Functions that are directly attributable or can be allocated on a reasonable basis to a specific segment are reported under the segment concerned. The financial performance of the Regions is measured at full value contribution to the performance of the Group to improve financial steering, transparency, and accountability. The segment results are based on the same accounting principles that are used to determine the operating profit of the Group. Intersegment transactions are based on the arm’s length principle.
Offering
dormakaba Group provides smart, secure, and sustainable solutions for seamless flow and integrated access. Its portfolio of strong brands offers customers the full range of products, solutions, and services for access to premises, buildings, and rooms. From award-winning, end-to-end access solutions to industry best practices and straightforward installation across a range of markets and industries, dormakaba is a complete partner for door and access systems, catering to a broad range of industries such as hotels, retail spaces, sporting venues, airports, hospitals, offices, utilities, and multi-housing, as well as in some selected residential markets.
With a clear portfolio segmentation, dormakaba focuses on its global core businesses Access Automation Solutions (door operators, sliding doors and revolving doors), Access Control Solutions (connected devices and engineered solutions), Access Hardware Solutions (door closers, exit devices, and mechanical, key systems) and Services. The Group is also a market leader for Key Systems (key blanks, key cutting machines, and automotive solutions such as transponder keys and programmers), as well as Movable Walls including acoustic movable partitions and horizontal and vertical partitioning systems.
Segment Reporting
|
|
|
Region Americas |
|
Region Asia Pacific |
|
Region Europe & Africa |
|
Eliminations |
|
Sales Regions Total |
|
Key & Wall Solutions |
|
Global Research and Development |
|
Corporate |
|
Eliminations |
|
Group |
||||||||||||||||||||
|
CHF million |
|
Financial year ended 30.06.2023 |
|
Financial year ended 30.06.2022 (restated) 1 |
|
Financial year ended 30.06.2023 |
|
Financial year ended 30.06.2022 (restated) 1 |
|
Financial year ended 30.06.2023 |
|
Financial year ended 30.06.2022 (restated) 1 |
|
Financial year ended 30.06.2023 |
|
Financial year ended 30.06.2022 (restated) 1 |
|
Financial year ended 30.06.2023 |
|
Financial year ended 30.06.2022 (restated) 1 |
|
Financial year ended 30.06.2023 |
|
Financial year ended 30.06.2022 (restated) 1 |
|
Financial year ended 30.06.2023 |
|
Financial year ended 30.06.2022 (restated) 1 |
|
Financial year ended 30.06.2023 |
|
Financial year ended 30.06.2022 (restated) 1 |
|
Financial year ended 30.06.2023 |
|
Financial year ended 30.06.2022 (restated) 1 |
|
Financial year ended 30.06.2023 |
|
Financial year ended 30.06.2022 (restated) 1 |
|
Net sales third parties |
|
772.2 |
|
736.8 |
|
542.5 |
|
543.1 |
|
1,152.5 |
|
1,125.7 |
|
0.0 |
|
0.0 |
|
2,467.2 |
|
2,405.6 |
|
381.6 |
|
351.3 |
|
0.0 |
|
0.0 |
|
0.0 |
|
0.0 |
|
0.0 |
|
0.0 |
|
2,848.8 |
|
2,756.9 |
|
Intercompany sales |
|
9.6 |
|
7.9 |
|
29.7 |
|
30.9 |
|
14.0 |
|
18.8 |
|
–45.4 |
|
–49.5 |
|
7.9 |
|
8.1 |
|
13.4 |
|
12.8 |
|
0.0 |
|
0.0 |
|
0.0 |
|
0.0 |
|
–21.3 |
|
–20.9 |
|
0.0 |
|
0.0 |
|
Total sales |
|
781.8 |
|
744.7 |
|
572.2 |
|
574.0 |
|
1,166.5 |
|
1,144.5 |
|
–45.4 |
|
–49.5 |
|
2,475.1 |
|
2,413.7 |
|
395.0 |
|
364.1 |
|
0.0 |
|
0.0 |
|
0.0 |
|
0.0 |
|
–21.3 |
|
–20.9 |
|
2,848.8 |
|
2,756.9 |
|
Adjusted EBIT (Operating profit) |
|
130.7 |
|
114.7 |
|
75.5 |
|
84.4 |
|
192.4 |
|
206.3 |
|
0.2 |
|
3.5 |
|
398.8 |
|
408.9 |
|
61.0 |
|
39.8 |
|
–105.8 |
|
–104.9 |
|
–46.5 |
|
–50.4 |
|
0.0 |
|
0.0 |
|
307.5 |
|
293.4 |
|
as % of sales |
|
16.7% |
|
15.4% |
|
13.2% |
|
14.7% |
|
16.5% |
|
18.0% |
|
–0.4% |
|
–7.1% |
|
16.1% |
|
16.9% |
|
15.4% |
|
10.9% |
|
0.0% |
|
0.0% |
|
0.0% |
|
0.0% |
|
0.0% |
|
0.0% |
|
10.8% |
|
10.6% |
|
Adjusted depreciation and amortization |
|
15.0 |
|
15.5 |
|
17.1 |
|
16.8 |
|
27.4 |
|
26.3 |
|
0.0 |
|
0.0 |
|
59.5 |
|
58.6 |
|
10.1 |
|
10.5 |
|
5.7 |
|
4.3 |
|
2.0 |
|
5.5 |
|
0.0 |
|
0.0 |
|
77.3 |
|
78.9 |
|
Adjusted EBITDA (Operating profit before depreciation and amortization) |
|
145.7 |
|
130.2 |
|
92.6 |
|
101.2 |
|
219.8 |
|
232.6 |
|
0.2 |
|
3.5 |
|
458.3 |
|
467.5 |
|
71.1 |
|
50.3 |
|
–100.1 |
|
–100.6 |
|
–44.5 |
|
–44.9 |
|
0.0 |
|
0.0 |
|
384.8 |
|
372.3 |
|
as % of sales |
|
18.6% |
|
17.5% |
|
16.2% |
|
17.6% |
|
18.8% |
|
20.3% |
|
–0.4% |
|
–7.1% |
|
18.5% |
|
19.4% |
|
18.0% |
|
13.8% |
|
0.0% |
|
0.0% |
|
0.0% |
|
0.0% |
|
0.0% |
|
0.0% |
|
13.5% |
|
13.5% |
|
CHF million |
|
Financial year ended 30.06.2023 |
|
Financial year ended 30.06.2022 1 |
|
Net working capital |
|
|
|
|
|
Group |
|
694.0 |
|
751.3 |
|
Region Americas |
|
139.6 |
|
147.0 |
|
Region Asia Pacific |
|
119.2 |
|
139.2 |
|
Region Europe & Africa |
|
193.3 |
|
187.0 |
|
Operations |
|
172.7 |
|
205.0 |
|
Key & Wall Solutions |
|
86.6 |
|
87.8 |
|
Corporate |
|
–17.4 |
|
–14.7 |
1 The internal functional allocation relating to the new operating model implemented as of January 2022 was further improved. To enable a fair comparison with the current year, prior-year disclosure was adjusted accordingly.
|
CHF million |
|
Financial year ended 30.06.2023 |
|
Financial year ended 30.06.2022 |
|
Capital expenditure |
|
|
|
|
|
Group |
|
98.5 |
|
78.5 |
|
Region Americas |
|
5.4 |
|
3.4 |
|
Region Asia Pacific |
|
5.7 |
|
6.0 |
|
Region Europe & Africa |
|
5.9 |
|
4.4 |
|
Operations |
|
31.8 |
|
31.7 |
|
Key & Wall Solutions |
|
10.2 |
|
7.8 |
|
Global Research and Development |
|
15.8 |
|
10.1 |
|
Corporate |
|
23.7 |
|
15.1 |
Reconciliation of operational figures
|
|
|
Financial year ended 30.06.2023 |
|
Financial year ended 30.06.2022 (restated) 2 |
||||||||
|
CHF million |
|
Adjusted |
|
IAC 1 |
|
Unadjusted |
|
Adjusted |
|
IAC 1 |
|
Unadjusted |
|
Operating profit before depreciation and amortization (EBITDA) |
|
384.8 |
|
–59.0 |
|
325.8 |
|
372.3 |
|
–30.3 |
|
342.0 |
|
Depreciation and amortization |
|
–77.3 |
|
–59.5 |
|
–136.8 |
|
–78.9 |
|
–160.1 |
|
–239.0 |
|
Operating profit (EBIT) |
|
307.5 |
|
–118.5 |
|
189.0 |
|
293.4 |
|
–190.4 |
|
103.0 |
1 Content of items affecting comparability (IAC) is described in the note alternative performance measures (APM) (5.2).
2 Details on the restatement are disclosed in chapter changes in accounting principles and restatement of previous period (5.1).
Operating model and organizational structure as of 1 July 2023
In line with its Shape4Growth strategy to boost profitable volume growth, dormakaba continues to strengthen its operating model by further optimizing its organizational structure.
The organizational structure was simplified by moving all AS commercial business into one functional unit under one leadership of a Chief Commercial Officer (CCO) with continued support by Global Functions Operations and Innovation. The company’s seven key markets (USA/Canada, Germany, Australia/New Zealand, Switzerland, UK/Ireland, China, and India) are now reporting directly to the CCO; together they represent 65% of Access Solutions sales. The original equipment manufacturing (OEM) business of Region Asia Pacific was moved to Key & Wall Solutions and the segment was renamed accordingly to Key & Wall Solutions and OEM.
Operating model
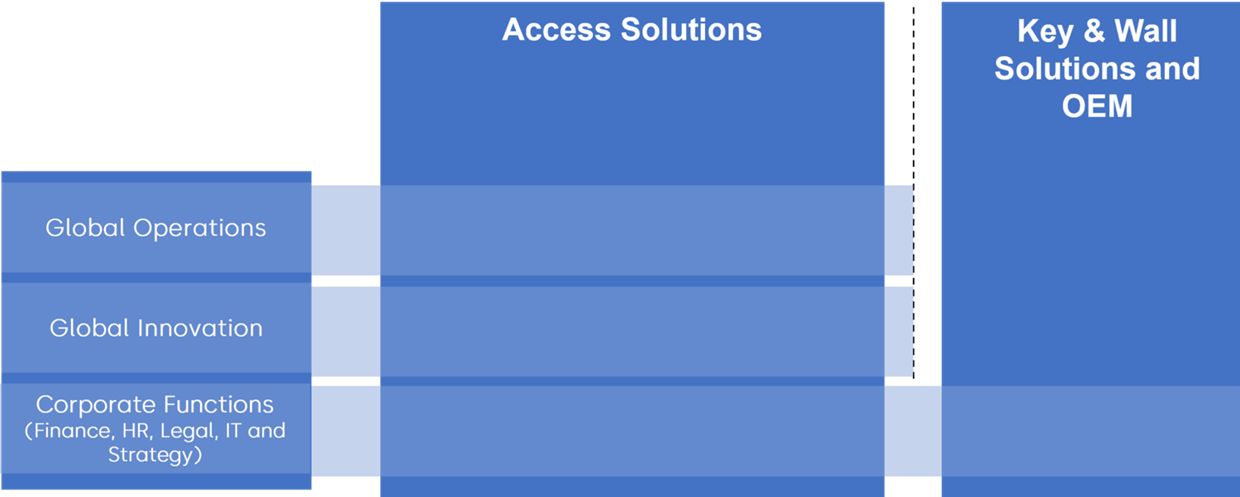
Organizational structure
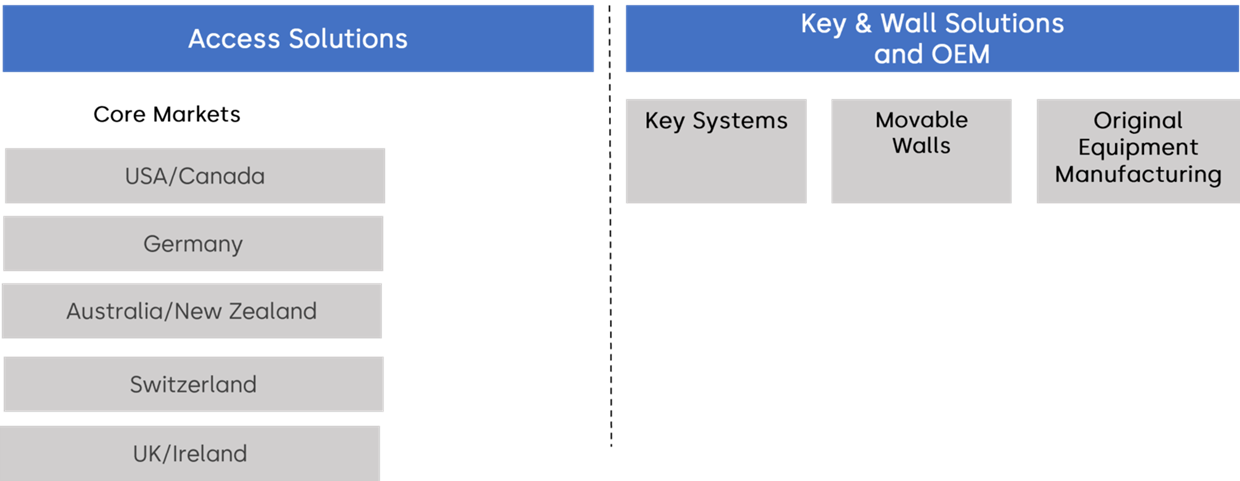
Segment reporting as of 1 July 2023
|
|
|
Access Solutions |
|
Key & Wall Solutions and OEM |
|
Corporate |
|
Eliminations |
|
Group |
||||||||||
|
CHF million |
|
Financial year ended 30.06.2023 |
|
Financial year ended 30.06.2022 |
|
Financial year ended 30.06.2023 |
|
Financial year ended 30.06.2022 |
|
Financial year ended 30.06.2023 |
|
Financial year ended 30.06.2022 |
|
Financial year ended 30.06.2023 |
|
Financial year ended 30.06.2022 |
|
Financial year ended 30.06.2023 |
|
Financial year ended 30.06.2022 |
|
Net sales third parties |
|
2,409.4 |
|
2,330.5 |
|
439.4 |
|
426.4 |
|
0.0 |
|
0.0 |
|
0.0 |
|
0.0 |
|
2,848.8 |
|
2,756.9 |
|
Intercompany sales |
|
4.7 |
|
4.7 |
|
46.9 |
|
48.0 |
|
0.0 |
|
0.0 |
|
–51.6 |
|
–52.7 |
|
0.0 |
|
0.0 |
|
Total sales |
|
2,414.1 |
|
2,335.2 |
|
486.3 |
|
474.4 |
|
0.0 |
|
0.0 |
|
–51.6 |
|
–52.7 |
|
2,848.8 |
|
2,756.9 |
|
Adjusted EBIT (Operating profit) |
|
284.7 |
|
296.5 |
|
69.3 |
|
47.3 |
|
–46.5 |
|
–50.4 |
|
0.0 |
|
0.0 |
|
307.5 |
|
293.4 |
|
as % of sales |
|
11.8% |
|
12.7% |
|
14.3% |
|
10.0% |
|
0.0% |
|
0.0% |
|
0.0% |
|
0.0% |
|
10.8% |
|
10.6% |
|
Adjusted depreciation and amortization |
|
61.8 |
|
59.3 |
|
13.5 |
|
14.1 |
|
2.0 |
|
5.5 |
|
0.0 |
|
0.0 |
|
77.3 |
|
78.9 |
|
Adjusted EBITDA (Operating profit before depreciation and amortization) |
|
346.5 |
|
355.8 |
|
82.8 |
|
61.4 |
|
–44.5 |
|
–44.9 |
|
0.0 |
|
0.0 |
|
384.8 |
|
372.3 |
|
as % of sales |
|
14.4% |
|
15.2% |
|
17.0% |
|
12.9% |
|
0.0% |
|
0.0% |
|
0.0% |
|
0.0% |
|
13.5% |
|
13.5% |
1.2 Net sales per geographical markets / business units
|
CHF million |
|
Financial year ended 30.06.2023 |
|
Financial year ended 30.06.2022 |
|
Net sales to third parties 1 |
|
|
|
|
|
USA/Canada |
|
717.8 |
|
688.1 |
|
Germany |
|
304.1 |
|
298.1 |
|
Australia/New Zealand |
|
212.8 |
|
196.0 |
|
Switzerland |
|
212.6 |
|
202.7 |
|
UK/Ireland |
|
111.9 |
|
114.6 |
|
Rest of the World AS |
|
850.2 |
|
831.0 |
|
Total Access Solutions |
|
2,409.4 |
|
2,330.5 |
|
Key & Wall Solutions and OEM |
|
439.4 |
|
426.4 |
|
Total Group |
|
2,848.8 |
|
2,756.9 |
1 Table adjusted to the operating model and organizational structure as of 1 July 2023.
1.3 Personnel expenses
|
CHF million, except FTE |
|
|
Financial year ended 30.06.2023 |
% |
|
Financial year ended 30.06.2022 |
% |
|
Personnel expenses |
|
|
1,127.9 |
100.0 |
|
1,093.9 |
100.0 |
|
Salaries and wages |
|
|
905.5 |
80.3 |
|
877.6 |
80.3 |
|
Social security expenses |
|
|
170.4 |
15.1 |
|
175.5 |
16.0 |
|
Share-based payments |
|
|
7.1 |
0.6 |
|
7.0 |
0.6 |
|
Pension cost (see note 2.5) |
|
|
35.6 |
3.2 |
|
27.0 |
2.5 |
|
Employment termination expenses |
|
|
8.3 |
0.7 |
|
6.0 |
0.5 |
|
Other benefits |
|
|
1.0 |
0.1 |
|
0.8 |
0.1 |
|
Employees at balance sheet date |
|
|
15,352 |
|
|
15,795 |
|
|
Average number of full-time equivalent employees |
|
|
15,519 |
|
|
15,495 |
|
|
Average number of employees per segment 1 |
|
|
15,519 |
100.0 |
|
15,495 |
100.0 |
|
Region Americas |
|
|
1,534 |
9.9 |
|
1,730 |
11.1 |
|
Region Asia Pacific |
|
|
3,561 |
22.9 |
|
3,527 |
22.8 |
|
Region Europe & Africa |
|
|
4,093 |
26.4 |
|
3,932 |
25.4 |
|
Operations |
|
|
3,225 |
20.8 |
|
3,188 |
20.6 |
|
Key & Wall Solutions |
|
|
1,905 |
12.3 |
|
1,918 |
12.4 |
|
Global Research and Development |
|
|
698 |
4.5 |
|
653 |
4.2 |
|
Corporate |
|
|
503 |
3.2 |
|
547 |
3.5 |
|
Average number of employees per geographical region |
|
|
15,519 |
100.0 |
|
15,495 |
100.0 |
|
Switzerland |
|
|
932 |
6.0 |
|
886 |
5.7 |
|
Germany |
|
|
2,788 |
18.0 |
|
2,768 |
17.9 |
|
Rest of EMEA |
|
|
4,018 |
25.9 |
|
3,842 |
24.8 |
|
Americas |
|
|
3,462 |
22.3 |
|
3,680 |
23.7 |
|
Asia Pacific |
|
|
4,319 |
27.8 |
|
4,319 |
27.9 |
1 The internal functional allocation relating to the new operating model implemented as of January 2022 was further improved. To enable a fair comparison with the current year, prior-year disclosure was adjusted accordingly.
Share-based payments
The Nomination and Compensation Committee nominates individual Executive Committee (EC) members and other members of Senior Management for long-term incentive awards. The long-term incentive award in the 2022/23 financial year is granted in full in the form of performance share units of dormakaba subject to a three-year performance-based vesting period. The award is designed to reward participants for the future performance of the earnings per share (EPS) and the relative total shareholder return (TSR) of the company over the three-year performance period. Both performance conditions are equally weighted at 50%. The vesting level may range from 0% to a maximum of 200% of the original number of units granted (maximum two shares for each performance share unit originally granted).
The fair value of the performance share units at the grant date comprises adjustments for lost dividends during the vesting periods and the TSR performance condition. The expenses for the performance share units are allocated on a straight-line basis over the vesting period.
The restricted shares allocated to the members of the Board of Directors (BoD) are blocked for three years.
The fair value of the restricted shares corresponds to the value of the closing price of the dormakaba Holding AG share on the SIX Swiss Exchange as at the business day prior to the date of the allocation.
Further information about the allocation of treasury shares is disclosed in the note on share capital and treasury shares (3.2), and further details about long-term incentive stock award plans are outlined in the Compensation Report.
1.4 Other operating expenses
|
CHF million |
|
Financial year ended 30.06.2023 |
|
Financial year ended 30.06.2022 (restated) 1 |
|
Total other operating expenses |
|
–62.1 |
|
–161.7 |
|
Goodwill amortization |
|
–59.5 |
|
–152.3 |
|
Loss from sale of subsidiaries |
|
0.0 |
|
–8.0 |
|
Other operating expenses |
|
–2.6 |
|
–1.4 |
1 Details on the restatement are disclosed in chapter changes in accounting principles and restatement of previous period (5.1).
1.5 Financial result
|
CHF million |
Note |
|
Financial year ended 30.06.2023 |
|
Financial year ended 30.06.2022 (restated) 1 |
|
Financial income |
|
|
1.5 |
|
1.1 |
|
Interest income |
|
|
1.4 |
|
0.8 |
|
Other financial income |
|
|
0.1 |
|
0.3 |
|
Financial expense |
|
|
48.9 |
|
29.5 |
|
Interest expenses for bonds |
3.1 |
|
10.6 |
|
3.5 |
|
Interest expenses for forward contracts |
3.4 |
|
14.4 |
|
5.4 |
|
Other interest expenses |
|
|
16.5 |
|
11.8 |
|
Foreign exchange losses (gains) |
3.4 |
|
4.3 |
|
6.0 |
|
Other financial expenses |
|
|
3.1 |
|
2.8 |
1 Details on the restatement are disclosed in chapter changes in accounting principles and restatement of previous period (5.1).
1.6 Taxes
Income taxes
The weighted applicable tax rate results from applying each subsidiary’s statutory income tax rate to the income before taxes. Since the group operates in countries that have different tax rates, the weighted applicable tax rate may vary from year to year according to variations in income per country and changes in applicable tax rates.
|
CHF million |
|
Financial year ended 30.06.2023 |
|
Financial year ended 30.06.2022 (restated) 1 |
|
Profit before taxes |
|
142.2 |
|
74.9 |
|
Weighted applicable tax rate |
|
24.8% |
|
24.9% |
|
Tax calculated at applicable tax rate |
|
35.3 |
|
18.6 |
|
Current income taxes |
|
48.7 |
|
49.3 |
|
Deferred income taxes |
|
5.0 |
|
–13.2 |
|
Income taxes |
|
53.7 |
|
36.1 |
|
Difference between applicable and effective income taxes |
|
18.4 |
|
17.5 |
|
Impact of losses and tax loss carryforwards |
|
–3.3 |
|
1.3 |
|
Tax-exempt income |
|
–3.8 |
|
–2.6 |
|
Non-deductible expenses |
|
6.3 |
|
5.2 |
|
Non-deductible goodwill amortization |
|
14.8 |
|
19.9 |
|
Non-recoverable withholding tax expenses |
|
3.4 |
|
2.2 |
|
Effect of change in tax rates |
|
2.2 |
|
–0.4 |
|
Tax charges (credits) relating to prior periods, net |
|
–0.3 |
|
–6.1 |
|
Other |
|
–0.9 |
|
–2.0 |
|
Income taxes charged to equity |
|
–0.7 |
|
0.2 |
1 Details on the restatement are disclosed in chapter changes in accounting principles and restatement of previous period (5.1).
The effective income tax rate of 37.8% (2021/22: 48.5%) is significantly impacted by the amortization of goodwill (see note changes in accounting principles and restatement of previous period (5.1)). Amortization of goodwill that is non-deductible for tax purposes results in an increase of the effective tax rate. The impact from “non-deductible goodwill amortization” is disclosed separately in the reconciliation above. Without this impact, the effective tax rate is 26.6% (2021/22: 22.9%). The lower rate in the previous year was mainly due to significant tax charges and credits of CHF 6.1 million relating to years before the financial year 2021/22.
Deferred taxes
|
CHF million |
|
Financial year ended 30.06.2023 |
|
Financial year ended 30.06.2022 |
|
Balance sheet presentation of deferred income taxes |
|
|
|
|
|
Total deferred income taxes, net |
|
112.0 |
|
123.9 |
|
Deferred income tax assets |
|
143.0 |
|
148.2 |
|
Deferred income tax liabilities |
|
31.0 |
|
24.3 |
|
Expiration of tax loss carryforwards not recognized as deferred tax assets |
|
|
|
|
|
Balance of tax loss carryforwards at end of financial year |
|
122.4 |
|
146.0 |
|
Expiry in 1 year |
|
2.1 |
|
2.5 |
|
Expiry in 2 to 5 years |
|
16.1 |
|
18.7 |
|
Expiry after 5 years |
|
8.5 |
|
13.4 |
|
No expiry |
|
95.7 |
|
111.4 |
These financial statements have been prepared without recognition of deferred tax assets and liabilities nor top-up taxes related to the ‘International Tax Reform – Pillar Two’. Developments are closely monitored, and it is expected that for dormakaba the Pillar Two rules will come into effect for the first time in the financial year 2024/25.