1.1 Segment reporting
Operating model and organizational structure
The Access Solutions (AS) business consists of the AS commercial business under the leadership of the Chief Commercial Officer (CCO) with support from Global Functions Operations and Innovation.
The company’s five core markets (USA/Canada, Germany, Australia/New Zealand, Switzerland, UK/Ireland) as well as China and India report directly to the CCO; together they represent around 70% of Access Solutions sales. To enable a strong customer focus and sales generation, the core markets are built around:
- Project and solution sales (“direct business”), focusing on end customers, general and technical contractors;
- Product and system sales (“indirect business”), focusing on distributors, value-added resellers, system integrators, and OEMs;
- Service sales, focusing on facility managers, building operators, or installers to support service growth as part of the global core;
- Furthermore, we support the above with pull sales generation via specification and support to architects, design engineers, planners, and other influencers.
The organizational setup includes one further segment Key & Wall Solutions and OEM (KWO). It operates as a standalone and self-contained segment with three global businesses – Key Systems, Movable Walls, and Original Equipment Manufacturing (OEM). Production facilities for Key Systems and Movable Walls are situated in North and South America, Europe, and Asia. The OEM business has plants in mainland China and Taiwan.
Operating model
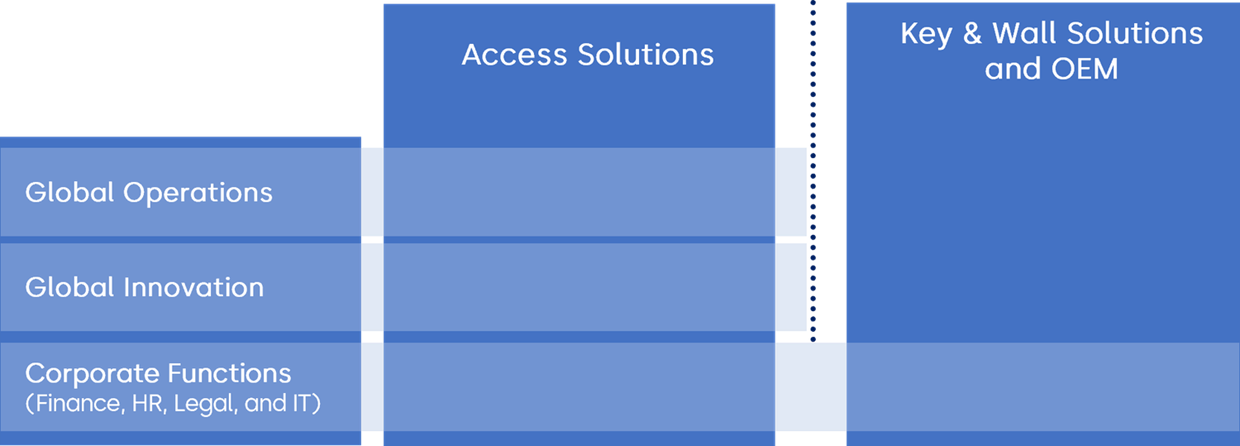
Global Innovation is responsible for delivering customer- and market-oriented product and solution developments and innovations. In cooperation with the Global Commercial function, it develops and steers innovations and technology strategies to foster dormakaba’s innovation leadership in the market.
Corporate Functions (Finance, HR, Legal, and IT) globally support the above business units and functions to steer the business, drive strategic initiatives, and strengthen the companyʼs customer centricity.
Organizational segment structure
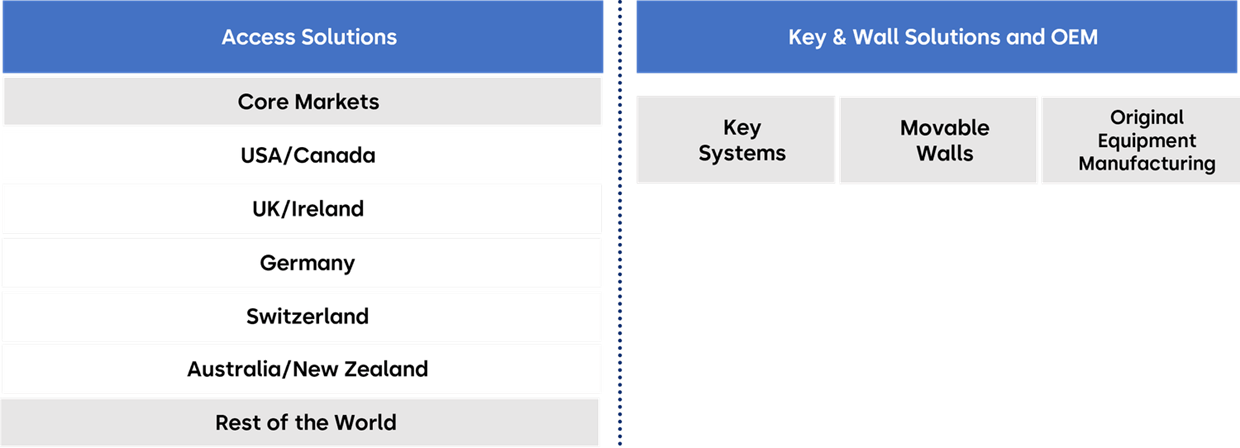
Financial performance is assessed by Group management across two operating segments; Access Solutions and Key & Wall Solutions and OEM (KWO). Within Access Solutions, performance is further monitored across the five core markets, Rest of the World, and Global Functions. Within KWO, performance is evaluated across the business units Key Systems, Movable Walls, and Original Equipment Manufacturing. As the Executive Committee assesses performance and allocates resources at the level of Access Solutions and KWO, segment reporting is presented on the same basis up to adjusted EBIT contribution. Financial transactions of Global Functions that are directly attributable to, or can be reasonably allocated to, a specific segment are reported within the respective segment. To enhance financial steering, transparency, and accountability, the performance of the core markets is measured based on their full contribution to the Group’s results. Segment results are prepared using the same accounting principles as those applied in determining the Group’s operating profit. Intersegment transactions are conducted on an arm’s length basis.
Offering
dormakaba Group provides smart, secure, and sustainable solutions for seamless flow and integrated access. Its portfolio of strong brands offers customers the full range of products, solutions, and services for access to premises, buildings, and rooms. From award-winning, end-to-end access solutions to industry best practices and straightforward installation across a range of markets and industries, dormakaba is a complete partner for door and access systems, catering to a broad range of industries such as hotels, retail spaces, sporting venues, airports, hospitals, offices, utilities, and multi-housing, as well as selected residential markets.
With a clear portfolio segmentation, dormakaba focuses on its global core businesses Access Automation Solutions (door operators, sliding doors, and revolving doors), Access Control Solutions (connected devices and engineered solutions), Access Hardware Solutions (door closers, exit devices, and mechanical key systems) and Services. The Group is also a market leader for Key Systems (key blanks, key cutting machines, and automotive solutions such as transponder keys and programmers), as well as Movable Walls, including acoustic movable partitions and horizontal and vertical partitioning systems.
Segment reporting
|
|
|
Access Solutions |
|
Key & Wall Solutions and OEM |
|
Corporate |
|
Eliminations |
|
Group |
||||||||||
|
CHF million |
|
Financial year ended 30.06.2026 |
|
Financial year ended 30.06.2025 |
|
Financial year ended 30.06.2026 |
|
Financial year ended 30.06.2025 |
|
Financial year ended 30.06.2026 |
|
Financial year ended 30.06.2025 |
|
Financial year ended 30.06.2026 |
|
Financial year ended 30.06.2025 |
|
Financial year ended 30.06.2026 |
|
Financial year ended 30.06.2025 |
|
Net sales third parties |
|
2,371.5 |
|
2,432.4 |
|
420.9 |
|
437.7 |
|
0.0 |
|
0.0 |
|
|
|
|
|
2,792.4 |
|
2,870.1 |
|
Intercompany sales |
|
5.7 |
|
8.3 |
|
47.7 |
|
50.7 |
|
0.0 |
|
0.0 |
|
–53.4 |
|
–59.0 |
|
0.0 |
|
0.0 |
|
Total sales |
|
2,377.2 |
|
2,440.7 |
|
468.6 |
|
488.4 |
|
0.0 |
|
0.0 |
|
–53.4 |
|
–59.0 |
|
2,792.4 |
|
2,870.1 |
|
Adjusted EBIT (Adjusted operating profit) |
|
332.1 |
|
318.7 |
|
86.1 |
|
89.7 |
|
–50.0 |
|
–42.3 |
|
|
|
|
|
368.2 |
|
366.1 |
|
as % of sales |
|
14.0% |
|
13.1% |
|
18.4% |
|
18.4% |
|
0.0% |
|
0.0% |
|
|
|
|
|
13.2% |
|
12.8% |
|
Adjusted depreciation and amortization |
|
65.6 |
|
63.9 |
|
13.2 |
|
13.0 |
|
2.0 |
|
2.0 |
|
|
|
|
|
80.8 |
|
78.9 |
|
Adjusted EBITDA (Adjusted operating profit before depreciation and amortization) |
|
397.7 |
|
382.6 |
|
99.3 |
|
102.7 |
|
–48.0 |
|
–40.3 |
|
|
|
|
|
449.0 |
|
445.0 |
|
as % of sales |
|
16.7% |
|
15.7% |
|
21.2% |
|
21.0% |
|
0.0% |
|
0.0% |
|
|
|
|
|
16.1% |
|
15.5% |
|
Net working capital |
|
600.4 |
|
598.2 |
|
86.8 |
|
91.2 |
|
–31.8 |
|
–28.6 |
|
|
|
|
|
655.4 |
|
660.8 |
|
Capital expenditure |
|
71.4 |
|
74.2 |
|
13.8 |
|
13.3 |
|
42.5 |
|
22.8 |
|
|
|
|
|
127.7 |
|
110.3 |
|
Average number of full-time equivalent employees |
|
11,547 |
|
11,752 |
|
3,361 |
|
3,253 |
|
402 |
|
420 |
|
|
|
|
|
15,310 |
|
15,425 |
Reconciliation of operational figures
|
|
|
Financial year ended 30.06.2026 |
|
Financial year ended 30.06.2025 |
||||||||
|
CHF million |
|
Adjusted |
|
IAC 1 |
|
Unadjusted |
|
Adjusted |
|
IAC 1 |
|
Unadjusted |
|
Operating profit before depreciation and amortization (EBITDA) |
|
449.0 |
|
–53.3 |
|
395.7 |
|
445.0 |
|
–44.7 |
|
400.3 |
|
Depreciation and amortization |
|
–80.8 |
|
–28.4 |
|
–109.2 |
|
–78.9 |
|
–24.7 |
|
–103.6 |
|
Operating profit (EBIT) |
|
368.2 |
|
–81.7 |
|
286.5 |
|
366.1 |
|
–69.4 |
|
296.7 |
1 The content of items affecting comparability (IAC) is described in the note on alternative performance measures (APM) (5.2).