Compensation architecture for the EC
dormakaba’s compensation system balances market competitiveness with internal equity, while rewarding performance and long-term value creation. The total target compensation (annual base salary, short-term incentive target and long-term incentive award) for each EC member is set according to the relevant market benchmark for their role and comprises a competitive fixed salary and a variable, performance-related component that is driven by the success of the company. This allows EC members to be rewarded for their contributions to the company’s success and long-term value creation. The overall compensation consists of the following elements:
- Annual base salary;
- Benefits (such as retirement benefits);
- Short-term incentive;
- Long-term incentive (share-based compensation).
|
|
Fixed Compensation and Benefits |
|
Variable Compensation (target of at least 50% of total direct compensation) |
||
|
|
Annual Base Salary |
Benefits |
|
Short-term incentive (STI) |
Long-term incentive (LTI) |
|
Purpose |
Reflects the function (scope, responsibilities and skills of the individual) |
Establishes a level of risk protection for the participants and their dependents |
|
Rewards short-term company performance |
Rewards long-term company performance, aligns with shareholdersʼ interests |
To ensure consistency of relative weighting across the organization, all roles (including the EC) are evaluated using the job evaluation methodology of Mercer. The job evaluation system is the basis for compensation activities such as benchmarking and determination of compensation structure and levels. For comparative purposes, dormakaba refers to external compensation studies (from Mercer, KornFerry and WillisTowersWatson) that are conducted regularly in most countries. Overall, these studies include compensation data from a representative sample of technology and industrial companies, including listed and privately held competitors in the security sector that are comparable with dormakaba in terms of annual revenues, number of employees, and complexity in the relevant national or regional markets. Consequently, there is no predefined peer group of companies that is used globally. Rather, the benchmark companies vary from country to country based on the available databases.
For the CEO role, the last benchmark review was done in June 2026, and was based on the same peer group as for the BoD, consisting of the following 11 Swiss listed companies: Bucher Industries, Clariant, Forbo, Georg Fischer, Landis+Gyr, OC Oerlikon, SFS Group, SIG Combibloc, Stadler Rail, Sulzer, and Tecan. The composition of the peer group is based on the following criteria: market capitalization, annual sales, business model, industry, and compensation practices. As a result of the benchmark review, the NCC decided to maintain the current level and structure of the CEO’s compensation.
Total target compensation approach
As a principle, the total target compensation (annual base salary, short-term incentive target and long-term incentive awarded) paid to EC members is based on the market median in the relevant national or regional market and must be within a range of -20% to +35% of this figure. The variable component of compensation (= short- and long-term incentives) is targeted to make up for at least 50% of the total direct compensation. Thereof, the equity-based compensation opportunity (value of long-term variable compensation) is at least 30% of the total direct compensation.
Illustration of total target compensation mix for CEO and EC members
The CEO’s annual total target direct compensation as of 1 July 2025 is composed of Annual Base Salary, Short-Term Incentive target and Long-Term Incentive target (each 33.3%), resulting in a balanced mix of fixed and variable components:
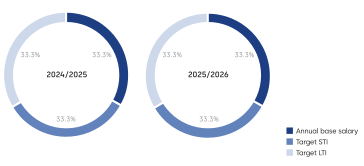
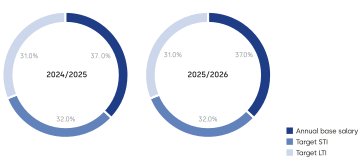
The annual total target direct compensation of active EC members as of 1 July 2025 is composed as follows and remains broadly unchanged from the prior year. Minor adjustments reflect the application of our Total Target Compensation approach, as described above and reflecting the appointment of a new member to the Executive Committee.
1. Annual base salary
EC members receive an annual base salary for fulfilling their role. It is based on the following factors:
- Scope, responsibilities, and complexity of the function;
- External market value of the respective role: amount paid for comparable positions in the industrial sector in the country where the member works;
- Individual profile in terms of skill set, experience, and seniority.
2. Benefits
EC members participate in the benefits plans available in their country of employment. Benefits mainly consist of retirement, insurance, and healthcare plans that are designed to provide a reasonable level of protection for the participants and their dependents in respect to the events of retirement, disability, death, and illness/accident. The EC members with a Swiss employment contract participate in the occupational pension plans offered to all employees in Switzerland, which consist of the dormakaba pension fund and a supplementary plan for management positions. The benefits offered by the pension fund of dormakaba in Switzerland are in line with benefits provided by other Swiss multinational industrial companies.
EC members under foreign employment contracts are insured commensurately with market conditions and with their position. Each plan varies in line with the local competitive and legal environment and is, as a minimum, in accordance with the legal requirements of the respective country.
Further, EC members are also provided with certain executive perquisites, such as a company car or car allowance, representation allowance, and other benefits in kind according to competitive market practice in their country of employment.
3. Variable compensation
The variable compensation consists of a short-term incentive (STI) and a long-term incentive (LTI).
3.1 Short-term incentive
The short-term incentive is a target-based variable incentive delivered in cash in the following financial year. It is designed to reward the overall collective performance of the company over a one-year period, in line with our pay-for-performance compensation principle.
Each EC member, including the CEO, is allocated a target STI amount based on the benchmark and pay mix policy corresponding to the incentive amount to be paid if all performance objectives are met (100% target achievement). The target STI amount is reviewed annually and expressed as an absolute amount. It is determined considering the organization level and external benchmark for a similar function in the relevant market, the positioning of the individual’s total target compensation compared to that benchmark and the target pay mix for the position.
As announced in the 2024/25 Compensation report, the STI framework for the 2025/26 financial year was refined to strengthen the link between measurable performance and rewards while maintaining alignment with dormakaba’s growth strategy. Specifically, Return on Capital Employed (ROCE) was replaced by Net Cash from Operating Activities Margin (NCOA Margin). This adjustment introduces a more operationally focused performance measure, thereby ensuring better alignment with the Company’s short-term objectives.
In addition, the weighting of the organic Net Sales component was increased to 50% to emphasize the importance of top-line growth. Consequently, the remaining two performance indicators, including NCOA Margin, were each assigned a weighting of 25%.
These adjustments apply to the STI framework for 2025/26, and reflect dormakaba’s continued focus on top-line organic growth, profitability, and cash generation.
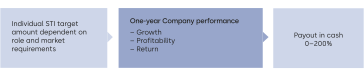
The table below sets out the STI payout range opportunity expressed as a percentage of the annual base salary and the STI performance metrics in terms of definition and weighting for the CEO and the other EC members.
STI payout range opportunity in % of annual base salary
|
|
|
Minimum |
|
100% Target achievement |
|
Maximum |
|
CEO |
|
0% (PY: 0%) |
|
100% (PY: 100%) |
|
200% (PY: 200%) |
|
Other active EC Members 1 |
|
0% |
|
72%–100% (PY: 71%–100%) |
|
145%–200% (PY: 142%–200%) |
1 Excludes one EC member who served on the Executive Committee for only two months during the reporting year and was therefore excluded from the calculation.
For the CEO, the STI target expressed as a percentage of the annual base salary is unchanged, and represents 100% of the annual base salary.
For other active EC members (excluding the CEO), the average STI target expressed as a percentage of the annual base salary increased to 92% (prior year: 85%). The STI target range increased marginally to 72%–100%, (prior year: 71%–100%). This reflects changes in job holders or expanded responsibilities based on which compensation packages were adjusted in line with our Total Target Compensation Approach, as well as local market practices.
The STI payout may range from 0% to a maximum of 200% of the target STI amount. There is no payout below the minimum threshold level of performance.
Overview of short-term incentive performance objectives and respective weightings for FY 2025/26
At the beginning of the performance period, the NCC approves the required minimum, target, and maximum values for the respective performance objectives. For performance below or at the minimum value, 0% is paid out, whereas on-target performance (budget) is rewarded with a 100% payout. In case of overperformance, up to 200% can be achieved. For all three performance objectives, linear interpolation applies between the minimum and the maximum as in the prior performance period.
For all STI-relevant performance objectives, the required achievement levels are derived from dormakaba’s strategic business plan and aligned with an ambitious budget for the respective financial year.
For FY 2025/26, the performance objectives and weightings were revised, with organic revenue weighted at 50%, EBITDA margin at 25%, and the newly introduced Net Cash from Operating Activities Margin (NCOA margin) at 25%. These changes further strengthen alignment with dormakaba’s strategic priorities by increasing the focus on top-line growth, profitability, and cash generation, while enhancing the link between performance and reward.
|
Performance indicators |
|
Organic net sales growth |
|
EBITDA margin |
|
NCOA margin |
|
Performance period |
|
Financial year 2025/26 |
||||
|
Weighting |
|
50% |
|
25% |
|
25% |
|
Purpose |
|
Measure growth achieved by internal initiatives |
|
Measure Group operational profitability |
|
Measure cash generation and drive net working capital improvements, ensuring stronger cash conversion as sales grow. |
|
Measurement |
|
Organic net sales compared to target, measured as deviation from budget |
|
Earnings before interest, taxes, depreciation and amortization (“EBITDA”) adjusted for Items Affecting Comparability (IAC) 1 as a percentage of net sales. |
|
Net Cash from Operating Activities (NCOA) 2 adjusted for Items Affecting Comparability (IAC) 1 as a percentage of net sales. |
1 Content of Items Affecting Comparability is described in the note 5.2 Alternative performance measures (APM).
2 Net Cash from Operating Activities (NCOA) is disclosed in the consolidated financial statements.
Disclosure of targets
Most of dormakaba’s competitors are privately held and disclose very limited financial and performance information. Disclosing further details on targets, which may include commercially sensitive information, would place dormakaba at a competitive disadvantage and ultimately not serve the best interests of our shareholders. Therefore, no further details on the required achievement levels are disclosed at the beginning of the performance period.
However, relevant performance achievements and the resulting STI payout factor for the financial year 2025/26 are disclosed in the sections "Compensation awarded to the EC in financial years 2025/26 and 2024/25" and "Performance in financial year 2025/26". The calculation of the short-term incentive is determined based on key performance indicators as reported in the financial statements.
Outlook for financial year 2026/27
For financial year 2026/27, the NCC further refined the STI framework applicable to EC members and selected members of the extended leadership team to ensure continued alignment with dormakaba’s strategic and operational priorities.
For the EC group, the STI remains predominantly based on financial performance metrics, which account for 80% of the total opportunity, and comprise organic revenue growth (40%), operating profit margin (20%), and operating cash flow margin (20%). These metrics continue to support dormakaba’s focus on organic top-line growth, profitability, and cash generation.
The remaining 20% of the STI is a weighted scorecard component, consisting of a limited number of pre-defined functional and/or individual objectives, which may include financial and non-financial measures aligned with key strategic priorities and tailored to individual roles. The scorecard is assessed against clearly defined performance criteria and is primarily based on quantitative measures, with linear payout mechanics applied where appropriate. The introduction of the scorecard enhances line-of-sight accountability, enables appropriate differentiation in individual performance outcomes, and provides measured flexibility within a clearly defined framework.
The STI continues to operate within a payout range of 0% to 200% of target, with no payout below threshold performance and linear interpolation between threshold, target, and maximum achievement levels. Target incentive opportunities remain unchanged.
Overall, the updated framework maintains a strong emphasis on financial performance, while ensuring that remuneration outcomes appropriately reflect both Group performance and individual contributions.
3.2 Long-term incentive
The purpose of dormakaba’s long-term incentive plan is to provide the EC with an ownership interest in the company and participation in its long-term performance, and thus to align their interests to those of dormakaba shareholders.
The LTI plan is a performance share unit (PSU) plan vesting over three years. At the beginning of the vesting period, a number of PSUs is granted to each EC member.
The grant size is reviewed annually and set as a monetary amount considering the organization level and external benchmark for a similar function in the relevant market, the positioning of the individual’s total target compensation compared to that benchmark, and the target pay mix for the position.
The number of PSUs granted is calculated by dividing the grant size (monetary amount) by the reference share price (volume-weighted average share price over three months preceding the grant date). Performance share units are usually awarded annually in September.
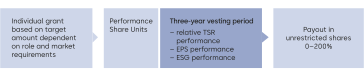
The PSUs vest after a period of three years, subject to the achievement of performance conditions, which remained unchanged compared to the prior reporting period. The LTI performance indicators include relative Total Shareholder Return (TSR), Earnings per Share (EPS), and targets related to Sustainability (ESG).
The tables below illustrate the LTI payout range opportunity expressed as a percentage of the annual base salary and the details on the LTI performance metrics in terms of definition and weighting for the CEO and the other EC members:
LTI payout range opportunity in % of annual base salary
The table below sets out the LTI payout amount opportunity expressed as a percentage of the annual base salary.
|
|
|
Minimum |
|
100% Target achievement |
|
Maximum |
|
CEO |
|
0% (PY: 0%) |
|
100% (PY: 100%) |
|
200% (PY: 200%) |
|
Other active EC Members 1 |
|
0% |
|
72%–100% (PY:63%–100%) |
|
145%–200% (PY: 144%–200%) |
1 Excludes one EC member who served on the Executive Committee for only two months during the reporting year and was therefore excluded from the calculation.
For the CEO, the LTI grant target expressed as a percentage of the annual base salary is unchanged, and represents 100% of the annual base salary.
For the other active EC members (excluding the CEO), the average LTI grant target expressed as a percentage of the annual base salary increased to 91% (prior year: 82%). The overall LTI grant range increased to 72%–100% of the annual base salary (prior year: 63%–100%). This reflects changes in incumbents, expanded responsibilities, and corresponding adjustments to compensation packages in line with our Total Target Compensation Approach and local market practices.
The vesting level may range from 0% to a maximum of 200% of the original number of units granted (maximum two shares for each performance share unit originally granted); there is no vesting below the threshold levels of performance. The vesting rules are detailed below.
Overview of long-term incentive performance objectives and respective weightings for performance period 2025–2028
|
Performance indicators |
|
TSR |
|
EPS 2) |
|
Sustainability |
||
|
Performance period |
|
Financial year 2025/26 to financial year 2027/28 (three years) |
||||||
|
Weighting |
|
40% of the PSU grant |
|
40% of the PSU grant |
|
10% of the PSU grant |
5% of the PSU grant |
5% of the PSU grant |
|
Purpose |
|
Align with dormakaba’s shareholder return |
|
Gain market shares in dormakaba’s relevant markets |
|
Contribute to climate change mitigation |
Foster a proactive safety culture |
Address customer needs in achieving green building standards and codes |
|
Measurement |
|
Share price increase + dividends over average of three percentile ranks compared to the SPI Industrial index 1) |
|
Average EPS growth during the three-year performance period compared to the three-year average EPS growth immediately preceding the performance period. The EPS growth must outperform the GDP growth in the relevant markets. |
|
Carbon Emission Savings (Scope 1+2 market-based) measured against baseline FY 2019/20 at the close of the three-year performance period. Based on the Science Based Targets initiative (SBTI) approved targets, dormakaba committed to saving 42% versus baseline FY 2019/20 until end of FY 2029/30. |
Safety Improvement: Reduction of recordable work-related injury rate with aim for –5.5% per annum (–33% at the close of the three-year performance period vs. baseline FY 20/21). This is measured by dividing the total number of recordable work-related injuries by the total working hours multiplied by the factor 200,000. |
Increased sustainability products declarations & certifications measured by a count of the total number of sustainability product declarations and certifications published on dormakaba Group website at the end of the three-year performance period. |
|
Target level 100% vesting |
|
Median of the peer group |
|
200 bps above GDP growth |
|
49,646 Scope 1+2 tCO 2 emissions (34% reduction vs. baseline FY 2019/20) |
0.85 injury rate (39% improvement vs. baseline FY 2020/21) |
368 sustainability product declarations or certifications |
|
|
|
|
||||||
|
Minimum 25% vesting |
|
25th percentile |
|
70% of target achievement |
|
52,001 Scope 1+2 tCO 2 emissions (30% reduction vs. baseline) |
0.91 injury rate (35% improvement vs. baseline) |
347 sustainability product declarations or certifications |
|
|
|
|
||||||
|
Maximum 200% vesting |
|
83.33th percentile |
|
140% of target achievement |
|
46,506 Scope 1+2 tCO 2 emissions (38% reduction vs. baseline) |
0.78 injury rate (44% improvement vs. baseline) |
396 sustainability product declarations or certifications |
|
|
|
|
||||||
1 The SPI Industrials index was selected as the performance benchmark because of the insufficient number of direct competitors of dormakaba that are publicly listed, which does not allow for a suitable customized peer group. Therefore, the SPI Industrials as an index of companies of comparable size listed on the SIX Swiss Exchange, was the most appropriate alternative.
2 In accordance with the LTI plan rules, the EPS calculation may be adjusted for extraordinary items in accordance with Alternative Performance Measures (APM) adjusted for Items Affecting Comparability (IAC) and must be approved by the Board.
The vesting formula has been designed in line with market practice for Swiss publicly listed companies to combine pay-for-performance principles with alignment to shareholder interests. It features appropriately challenging targets and a balanced level of leverage. At target performance, the company is required to perform at or above the median of the peer group in terms of relative TSR and to exceed GDP growth by 2 percentage points under the EPS condition. Sustainability performance targets included in the LTI are aligned with the sustainability framework approved by the Board of Directors in 2021. There is no payout below threshold levels of performance, while partial vesting occurs for performance between threshold and target. Conversely, achieving the maximum payout of 200% requires exceptional performance.
Outlook for financial year 2026/27
As announced in last year’s report, the NCC has undertaken a thorough review of the LTI performance indicator landscape to ensure continued alignment between the long-term strategic priorities of the company and the metrics used to determine the vesting factor of the PSU grants. This review has resulted in a decision to make some significant changes to the LTI plan design.
Key changes at a glance
- The number of metrics is reduced from five to four, including three financials and one ESG metric.
- Financial metrics, equally weighted (30% each):
– Introduction of a Total Revenue Growth metric to reflect our long-term ambition of gaining relative market share through organic and inorganic top line growth.
– Replacement of Earnings per Share (EPS) by Return on Capital Employed (ROCE) as a more appropriate proxy for our long-term capital efficiency.
– Total Shareholder Return has been retained to ensure continued alignment with shareholder interests. - All financial performance metrics are measured relative to a customized peer group of companies facing the same external factors.
- ESG focuses on Carbon Emission Reduction with a 10% weight.
- Steeper performance-sensitive payout curve to further strengthen pay-for-performance alignment.
These changes reflect dormakaba’s continued focus on delivering sustainable profitable growth, disciplined capital allocation, and long-term shareholder value creation. The revised LTI framework simplifies the performance landscape, emphasizes relative performance against companies who face a similar external economic context, and further strengthens the alignment between executive remuneration and value creation for shareholders.
The following table illustrates the simplification and rebalancing of LTI metrics from FY 2025/26 to FY 2026/27:
|
Evolution of LTI Metrics |
||||
|
Previous Grant (FY 2025/26) |
|
Next Grant (FY 2026/27) 1 |
||
|
KPI |
Weight |
KPI |
Weight |
|
|
Relative TSR |
40% |
Relative TSR |
30% |
|
|
EPS |
40% |
Relative ROCE |
30% |
|
|
Sustainability (ESG) metrics, consisting of: |
|
Relative TRG 2 |
30% |
|
|
– Carbon Emission Reduction – Improved Safety – Increased Sustainability Product Declarations |
10% 5% 5% |
Carbon Emission Reduction |
10% |
|
|
Number of metrics |
5 |
Number of metrics |
4 |
|
1 Illustrates the simplification and rebalancing of LTI performance metrics effective for grants made from FY 2026/27 onwards.
2 Relative TRG (Total Revenue Growth)
The table below summarizes the purpose, weighting, measurement methodology and payout framework of each performance measure applicable as from the FY 2026/27 grant:
|
Performance measure |
|
Relative TSR |
|
Relative ROCE |
|
Relative TRG |
|
Carbon Emission |
|
Purpose |
|
Align executive remuneration outcomes with shareholder value creation |
|
Promote efficient capital allocation and capital efficiency |
|
Reward sustainable organic and inorganic growth and market share expansion |
|
Support delivery of sustainability commitments |
|
Weighting |
|
30% |
|
30% |
|
30% |
|
10% |
|
Performance measurement |
|
Relative average percentile ranking against a defined peer group |
|
Relative average percentile ranking against a defined peer group |
|
Relative average percentile ranking against a defined peer group |
|
Carbon emission reduction measured against established baseline |
|
Target level |
|
Median peer-group performance = 100% payout |
|
Median peer-group performance = 100% payout |
|
Median peer-group performance = 100% payout |
|
Target carbon emission reduction achievement = 100% payout |
|
Maximum payout level |
|
200% |
|
200% |
|
200% |
|
200% |
|
Strategic rationale |
|
Aligns executive remuneration outcomes with shareholder value creation and shareholder experience |
|
Promotes capital efficiency, disciplined capital allocation and long-term value creation |
|
Supports dormakaba’s growth ambitions and encourages outperformance relative to peers |
|
Supports dormakaba’s climate strategy through continued focus on carbon emission reduction |
|
Vesting / payout rules 1 |
|
– Below minimum performance threshold: 0% payout. – Target performance: 100% payout. – Above maximum performance threshold: 200% payout. – Linear interpolation applies between threshold, target and maximum performance levels. |
||||||
1 Subject to three-year performance period (2026-2029)
No changes are envisaged with respect to the general plan design framework, including eligibility, target incentive opportunities, the use of Performance Share Units (PSUs), and the vesting range of 0% to 200%.
The details of the performance measurement applicable for the FY 2026/27 LTI grant, including payout curve and peer group for relative performance, will be disclosed in the Compensation report 2026/27.
Termination provisions
In the case of voluntary termination by the participant or if a participant is terminated for cause, performance share units are forfeited without any compensation. In the case of termination without cause or retirement, performance share units are subject to a pro rata vesting at the regular vesting date. In case of disability, death, or change of control, performance share units are subject to an accelerated pro rata vesting based on a performance assessment by the BoD (see also Corporate Governance Report). The conditions for the awarding of performance share units are governed by the stock award plans of dormakaba.
Malus and claw-back provisions
The long-term incentive awards are subject to claw-back and malus provisions. In certain circumstances, such as in the case of financial restatement due to material non-compliance with financial reporting requirements, fraudulent behavior or substantial willful misconduct, the BoD may decide to suspend the vesting or forfeit any granted long-term incentive award (malus provision), or to require the reimbursement of vested shares delivered under the long-term incentive (claw-back provision).
4. Employment contracts
EC members are employed under employment contracts of unlimited duration that are subject to a notice period of up to 12 months. EC members are not contractually entitled to sign-on awards, termination payments, or any change of control provisions other than the accelerated vesting mentioned above. The employment contracts of EC members may include post-employment non-compete clauses for a duration of up to two years. In cases where the company decides to activate the post-employment non-compete provision, the compensation paid in connection with such non-compete provision may not exceed the lower of the last monthly base salary, or the average monthly total compensation over the last 3 years, for the period the non-compete obligation is enforced.
5. Shareholding ownership guideline
EC members are required to own a minimum multiple of their annual base salary in dormakaba shares within five years of their hiring or promotion to the EC, as set out in the following table:
|
CEO |
|
300% of annual base salary |
|
EC member |
|
200% of annual base salary |
To calculate whether the minimum holding requirement is met, all vested shares are considered, regardless of whether they are restricted or not. However, unvested performance share units are excluded from the calculation. The NCC reviews compliance with the Share Ownership Guideline (SOG) on an annual basis. In the event of a substantial rise or drop in the share price, the BoD may, at its discretion, review the minimum ownership requirement. As of 30 June, all EC members comply with the SOG. In line with the SOG the respective EC members are required to hold all shares vesting from the LTI until such requirement is fulfilled.