BoD and EC compensation
The actual compensation paid to the BoD for the financial year 2025/26 is comparable to the previous year. All Board members stood for re-election at the AGM 2025 and were re-elected by the shareholders, resulting in no changes to the composition of the Board. Total Board compensation remains aligned with the Company’s established framework.
Compensation awarded to the BoD in the financial years 2025/26 and 2024/25 (audited)
|
|
|
BoD functions FY 25 – 26 |
|
BoD compensation FY 25/26 |
|
BoD compensation FY 24/25 |
||||||||||
|
|
|
|
|
|
|
Compensation 1 |
|
|
|
|
Compensation 4 |
|
|
|
||
|
|
|
BoD |
AC |
NCC |
|
Basic compensation |
Additional compensation (committees, special tasks) 2 |
Social benefits 3 |
Total |
of which in shares 1 |
|
Basic compensation |
Additional compensation (committees, special tasks) 5 |
Social benefits 6 |
Total |
of which in shares 4 |
|
CHF in 000 |
|
|
|
|
|
|
|
|
|
|
|
|
|
|
|
|
|
BoD |
|
|
|
|
|
|
|
|
|
|
|
|
|
|
|
|
|
Svein Richard Brandtzaeg |
|
C |
|
C |
|
635 |
– |
83 |
718 |
300 |
|
635 |
– |
95 |
730 |
299 |
|
Thomas Aebischer |
|
M |
C |
|
|
190 |
80 |
18 |
288 |
90 |
|
190 |
80 |
18 |
288 |
90 |
|
Jens Birgersson |
|
M |
M |
|
|
190 |
20 |
– |
210 |
90 |
|
190 |
20 |
– |
210 |
90 |
|
Stephanie Brecht-Bergen |
|
M |
|
M |
|
190 |
20 |
– |
210 |
140 |
|
190 |
20 |
– |
210 |
139 |
|
Hans Gummert |
|
M |
M |
|
|
190 |
75 |
– |
265 |
90 |
|
190 |
77 |
– |
267 |
90 |
|
Marianne Janik |
|
M |
|
|
|
190 |
– |
12 |
202 |
157 |
|
127 |
– |
8 |
135 |
100 |
|
Ilias Laeber |
|
M |
|
|
|
190 |
– |
12 |
202 |
157 |
|
127 |
– |
8 |
135 |
100 |
|
John Y. Liu 7 |
|
M |
|
|
|
– |
– |
– |
– |
– |
|
63 |
– |
4 |
67 |
30 |
|
Kenneth Lochiatto |
|
M |
|
M |
|
190 |
20 |
– |
210 |
90 |
|
190 |
20 |
– |
210 |
90 |
|
Ines Poeschel |
|
M |
|
M |
|
190 |
20 |
14 |
224 |
152 |
|
190 |
20 |
14 |
224 |
90 |
|
Michael Regelski |
|
M |
|
|
|
190 |
– |
– |
190 |
90 |
|
190 |
– |
– |
190 |
90 |
|
Total BoD |
|
|
|
|
|
2,345 |
235 |
139 |
2,719 |
1,355 |
|
2,282 |
237 |
147 |
2,666 |
1,205 |
1 The compensation for the reporting period is paid out in three installments (November 2025, May 2026, and November 2026). Shares are awarded based on a fixed monetary amount of CHF 300,000 for the Board Chair and CHF 90,000 for the Board members. The average of the closing share prices of the last five trading days in the month prior to the payment is used to determine the number of shares allocated (CHF 69.24 for the shares transferred in November 2025 and CHF 52.06 for the shares transferred in May 2026).
2 Compensation for the employer representative on the Swiss pension fund (Thomas Aebischer since May 2023) of CHF 20,000 p.a. and compensation for the membership of the Supervisory Board of dormakaba Holding GmbH + Co. KGaA (Hans Gummert) of CHF 55,346.47 relating to FY 2025/26 are included in the compensation as additional compensation. The compensation for Hans Gummert is paid in EUR and the amount reported in CHF is subject to exchange rate fluctuations. Business expenses are not included.
3 Social benefits comprise employer contributions to statutory social security schemes. No Board member was insured in the company’s pension fund during FY 2025/26.
4 The compensation for the reporting period is paid out in three installments (November 2024, May 2025, and November 2025). Shares are awarded based on a fixed monetary amount of CHF 300,000 for the Board Chair and CHF 90,000 for the Board members. The average of the closing share prices of the last five trading days in the month prior to the payment is used to determine the number of shares allocated (CHF 659.80 for the shares transferred in November 2024 and CHF 666.80 for the shares transferred in May 2025).
5 Compensation for the employer representative on the Swiss pension fund (Thomas Aebischer since May 2023) of CHF 20,000 p.a. and compensation for the membership of the Supervisory Board of dormakaba Holding GmbH + Co. KGaA (Hans Gummert) of CHF 56,557 relating to FY 2024/25 are included in the compensation as additional compensation. The compensation for Hans Gummert is paid in EUR and the amount reported in CHF is subject to exchange rate fluctuations. Business expenses are not included.
6 In line with Swiss legal requirements under the BVG, one Board member was insured in the company pension fund during FY 2024/25. The Board members financed both the employee and employer pension contributions so that participation in the pension fund was cost-neutral to the company.
7 John Y. Liu did not stand for re-election at the 2024 AGM
At the AGM 2025, the shareholders approved a maximum aggregate amount of CHF 3,200,000 for the BoD compensation period from the AGM 2025 until the AGM 2026. The compensation effectively paid for the portion of this term of office included in this Compensation Report (October 2025–30 June 2026) is within the limit approved by the shareholders. A conclusive assessment for the entire period will be included in the Compensation Report 2026/27.
As of 30 June 2026 and in compliance with the Articles of Incorporation, no loans or credits were granted to current or former BoD members, or parties closely related to them.
Compensation awarded to the EC in the financial years 2025/26 and 2024/25 (audited)
|
|
|
EC compensation FY 25/26 |
|
EC compensation FY 24/25 |
||||||
|
|
|
EC Members |
Total CHF |
|
EC Members |
|
Total CHF |
|||
|
in CHF 000 |
|
Till Reuter, CEO |
Other EC |
Former EC |
|
|
Till Reuter, CEO |
Other EC |
Former EC 5 |
|
|
|
|
|
|
|
|
|
|
|
|
|
|
Fixed compensation 4 |
|
|
|
|
|
|
|
|
|
|
|
Fixed basic payment |
|
1,050 |
2,078 |
– |
3,128 |
|
1,000 |
2,015 |
537 |
3,552 |
|
Benefits and social / pension contributions 1 |
|
189 |
740 |
– |
929 |
|
138 |
620 |
193 |
951 |
|
Total aggregate amount |
|
1,239 |
2,818 |
– |
4,057 |
|
1,138 |
2,635 |
730 |
4,503 |
|
|
|
|
|
|
|
|
|
|
|
|
|
Variable compensation |
|
|
|
|
|
|
|
|
|
|
|
|
|
|
|
|
|
|
|
|
|
|
|
STI 2 |
|
836 |
1,508 |
– |
2,344 |
|
1,185 |
1,888 |
757 |
3,830 |
|
LTI 3 |
|
1,015 |
1,888 |
– |
2,903 |
|
1,001 |
1,438 |
– |
2,439 |
|
Social / pension contributions |
|
260 |
794 |
– |
1,054 |
|
250 |
745 |
259 |
1,254 |
|
Total aggregate amount |
|
2,111 |
4,190 |
– |
6,301 |
|
2,436 |
4,071 |
1,016 |
7,523 |
|
|
|
|
|
|
|
|
|
|
|
|
|
Total |
|
3,350 |
7,008 |
– |
10,358 |
|
3,574 |
6,706 |
1,746 |
12,026 |
1 Includes contributions to social security and occupational pension or retirement plans, as well as fringe benefits. Contributions to social security and occupational pension or retirement plans represent the amounts effectively paid during the reporting year and relate to the fixed and variable compensation paid during the reporting period. For the U.S.-based EC member, contributions also include employer contributions to the 401(k) retirement plan. Fringe benefits include elements such as the private use of a company car, company car allowances, housing contributions, long-service awards and compensation for unused annual leave.
2 The short-term incentive disclosed for the reporting year is paid after the end of the respective reporting period.
3 The LTI grant consists solely of PSUs. The value of the PSUs is based on their fair value at grant date and includes adjustments for foregone dividends during the vesting period as well as the TSR performance condition. The Company executed a 1-for-10 share split in October 2025, which had no impact on the reported grant values. The value of LTIP awards upon vesting may vary depending on the level of performance achieved and the Company’s share price at the vesting date.
4 The fixed compensation for FY 2024/25 includes a temporary monthly allowance for an EC member assuming additional ad interim responsibility for the vacant COO position. The allowance was paid from 1 February 2024 to 31 July 2024 and relates exclusively to FY 2024/25.
5 The compensation of former EC members includes compensation paid until the end of the contractual employment period and reflects the related contractual obligations. It also includes final settlement payments made following employment termination.
In financial year 2025/26, the EC received total remuneration of CHF 10,358,000, which is within the maximum amount approved by the shareholders. The highest paid individual was Till Reuter, CEO. In comparison to the previous year, total remuneration received by the EC decreased by 14%. There are several factors that impacted the level of actual compensation paid to the EC, which are summarized in the explanatory comments to the compensation table below.
Explanatory comments to the compensation table
Changes in EC composition: During the reporting period, David Fuller was appointed to the Executive Committee as Chief Innovation Officer under a U.S. employment contract effective 1 September 2025. Magín Guardiola, who served as Chief Innovation Officer under a Swiss employment contract, stepped down from the Executive Committee effective 31 August 2025. Accordingly, the reported compensation includes the pro-rated remuneration of Magin Guardiola as well as the pro-rated compensation of David Fuller.
Considering all changes, a total of seven EC members received compensation in the reporting year (2024/25: nine EC members in total). Of the total number of EC members in the reporting period, six were active at the end of the reporting period (end of 2024/25: six active EC members).
Compensation changes: The total target compensation for two EC members was increased in aggregate by 5.6% compared to the prior reporting period to bring compensation in line with dormakaba’s compensation mix guidelines and desired market positioning. For the remaining EC members active throughout the reporting year, the total target compensation remained stable compared to the prior reporting period.
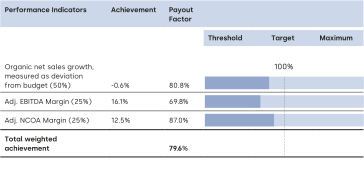
STI payout: The STI payout formula is based on the achievement of pre-determined performance objectives (as described under section 3.1). The STI payout for the CEO and EC members reflects the development of the Group's organic net sales, adjusted EBITDA margin and adjusted NCOA margin, which are the main drivers of the STI payout. The STI payout for all EC members is 79.6% of the STI target incentive amount (prior year: average of 115%).
The achievement per KPI is outlined in the STI performance section below.
LTI grant in September 2025: The grant size (nominal value) for each participant including the CEO was set as a monetary amount strictly considering the organization level and external benchmark for a similar function in the relevant market, the positioning of the individual’s total direct compensation compared to that benchmark and the target pay mix for the position (as described under section 3.2).
The total grant amount reported is 10% higher compared to the amount reported for the prior reporting period for the following reasons: In the reporting period LTI grants were made to seven EC members (prior reporting period: six EC members). One EC member received a pro-rated grant to account for his eligibility for the period 1 July to 31 August 2025, while a new EC member became eligible effective 1 September 2025 and therefore received a pro-rated grant reflecting his start date. In addition, the LTI grant levels for two EC members were increased in aggregate by 7.1% to align with dormakaba’s compensation mix guideline and desired market positioning. No grants were made to EC members that were not active at the time of the grant.
Performance in the financial year 2025/26 (not audited)
STI performance
The STI performance achievement and payout range for the performance objectives (as described under section 3.1) are illustrated in the table below. As explained in section 3.1, this represents commercially sensitive information; therefore, no further details on the required achievement levels are disclosed.
For all STI-relevant performance objectives, the required achievement level is derived from the company’s strategic business plan and aligned with an ambitious budget for the respective financial year.
The calculation of the short-term incentive is determined based on key performance indicators as reported in the financial statements.
dormakaba’s solid performance in the financial year 2025/26 is reflected in the STI overall performance factor of 79.6% (prior year: 118.5%) for the Group.
Organic net sales growth: The company achieved organic net sales growth of 3.0%, in line with guidance, amid a challenging external environment marked by trade tariffs and geopolitical tensions.
Adjusted EBITDA margin: The adjusted EBITDA margin increased from 15.5% to 16.1%. This significant margin expansion is mainly due to the execution of the strategy-related transformation program, demonstrating the results of effective and sustainable cost management, as well as reflecting efficiency improvements from complexity reduction.
Adjusted NCOA margin: The adjusted NCOA margin increased from 11.7% to 12.5%, mainly as a result of improved net working capital from inventory optimization and enhanced payment terms.
LTI performance
The performance share units granted under the long-term incentive in September 2022 vested in September 2025 are based on the EPS growth (50% weight) and the TSR ranking (50% weight) over the three-year vesting period at a total vesting level of 148.06% (prior year: 78.25%). The performance per KPI and the payout level at vesting are illustrated below.
|
Grant |
Performance Objectives |
Definition |
Target |
Achievement |
Performance & Vesting Factor |
|
Sept 2022 vested Sept 2025 |
Relative TSR (50%) |
Share price increase + dividends over average of three percentile ranks compared to the SPI Industrial index |
Median of the peer group |
Average ranking of 69.27% within the Peer Group |
157.80% Performance Factor * 50% = 78.90% Vesting Factor |
|
Relative EPS Growth (50%) |
Average EPS growth during the three-year performance period compared to the three-year average EPS growth immediately preceding the performance period, compared to the GDP growth in the relevant markets. The EPS growth must outperform the GDP growth in the relevant markets. |
The EPS growth must outperform the weighted GDP growth in the relevant markets by 200 bps. |
The average EPS growth exceeded the GDP growth in the relevant markets. Taking into account the 2 % point additional hurdle, this results in an achievement of 115.33%. |
138.31% Performance Factor * 50% = 69.16% Vesting Factor |
|
|
|
Total |
Overall Vesting Factor: 148.06 % |
|||
|
Sept 2021 vested Sept 2024 |
Relative TSR (50%) |
Share price increase + dividends over average of three percentile ranks compared to the SPI Industrial index |
Median of the peer group |
Average ranking of 42.67% within the Peer Group |
78% Performance Factor * 50% = 39% Vesting Factor |
|
Relative EPS Growth (50%) |
Average EPS growth during the three-year performance period compared to the three-year average EPS growth immediately preceding the performance period, compared to the GDP growth in the relevant markets. The EPS growth must outperform the GDP growth in the relevant markets. |
The EPS growth must outperform the weighted GDP growth in the relevant markets by 200 bps. |
The average EPS growth is 95.8%. The GDP growth is 2.8%. Under consideration of the 2% additional hurdle, this results in a 91.4% achievement. |
78.50% Performance Factor * 50% = 39.25% Vesting Factor |
|
|
|
Total |
Overall Vesting Factor: 78.25 % |
|||
Compensation mix awarded in reporting period
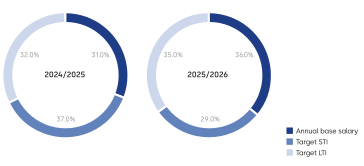
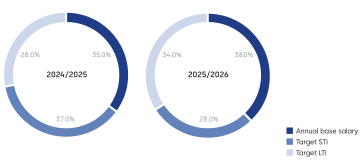
The table below represents the pay mix of the CEO and active EC members for the actual Annual Base Salary (ABS) pay and STI and LTI (excluding benefits and social security), which is in line with our compensation strategy and pay-for-performance principles.
CEO
EC1
Compensation paid compared to budget approved by shareholders
At the AGM 2024, the shareholders approved a maximum aggregate amount of CHF 15,900,000 for the EC for the financial year 2025/26. The total compensation effectively awarded of CHF 10,358,000 is within the limit approved by the shareholders.
Loans and credits
As of 30 June 2026, in compliance with the Articles of Incorporation, no loans or credits were granted by dormakaba to current or former EC members, or parties closely related to them.
Shares held by BoD and EC (audited)
As at the respective call date, the individual BoD and EC members (including related parties) held the following number of shares in dormakaba Holding AG.
As of 30 June 2026, all BoD and EC members comply with the respective share ownership guidelines.
|
Number of shares 3) |
|
Financial year ended 30.06.2026 |
|
Financial year ended 30.06.2025 |
|
BoD |
|
|
|
|
|
Brandtzaeg Svein Richard |
|
17,997 |
|
12,950 |
|
Lochiatto Kenneth |
|
8,923 |
|
7,410 |
|
Aebischer Thomas |
|
9,553 |
|
8,040 |
|
Birgersson Jens |
|
17,583 |
|
29,270 |
|
Brecht-Bergen Stephanie |
|
2,232,995 |
|
2,230,820 |
|
Gummert Hans |
|
18,383 |
|
16,870 |
|
Janik Marianne |
|
4,129 |
|
1,270 |
|
Laeber Ilias |
|
4,129 |
|
1,270 |
|
Poeschel Ines |
|
6,152 |
|
3,370 |
|
Regelski Michael |
|
6,023 |
|
4,510 |
|
Total BoD |
|
2,325,867 |
|
2,315,780 |
|
EC |
|
|
|
|
|
Baur Christian |
|
- |
|
- |
|
Bewick Stephen |
|
17,290 |
|
9,100 |
|
Franke Carsten |
|
- |
|
- |
|
David W Fuller 1 |
|
- |
|
- |
|
Guardiola Magín 2 |
|
- |
|
13,400 |
|
Peter René |
|
5,050 |
|
3,420 |
|
Reuter Till |
|
10,460 |
|
460 |
|
Total EC |
|
32,800 |
|
26,380 |
1) EC Member as of 1 September 2025
2) EC Member until 31 August 2025
3) The Annual General Meeting approved the 1-for-10 share split on 21 October 2025. To enable a fair comparison with the current year, prior-year disclosure was adjusted accordingly.