Notes to the consolidated financial statements for the 2025/26 financial year
1. Performance
This section provides information on the operational performance of the dormakaba Group and the current operating model, the outlook on the organizational changes, and its implication on the operating model, as well as on the segment disclosure. The description of the operating model provides information useful for understanding the segment reporting, which corresponds to the Groupʼs internal reporting system. In addition, information is presented on selected income and expense items.
1.1 Segment reporting
Operating model and organizational structure
The Access Solutions (AS) business consists of the AS commercial business under the leadership of the Chief Commercial Officer (CCO) with support from Global Functions Operations and Innovation.
The company’s five core markets (USA/Canada, Germany, Australia/New Zealand, Switzerland, UK/Ireland) as well as China and India report directly to the CCO; together they represent around 70% of Access Solutions sales. To enable a strong customer focus and sales generation, the core markets are built around:
- Project and solution sales (“direct business”), focusing on end customers, general and technical contractors;
- Product and system sales (“indirect business”), focusing on distributors, value-added resellers, system integrators, and OEMs;
- Service sales, focusing on facility managers, building operators, or installers to support service growth as part of the global core;
- Furthermore, we support the above with pull sales generation via specification and support to architects, design engineers, planners, and other influencers.
The organizational setup includes one further segment Key & Wall Solutions and OEM (KWO). It operates as a standalone and self-contained segment with three global businesses – Key Systems, Movable Walls, and Original Equipment Manufacturing (OEM). Production facilities for Key Systems and Movable Walls are situated in North and South America, Europe, and Asia. The OEM business has plants in mainland China and Taiwan.
Operating model
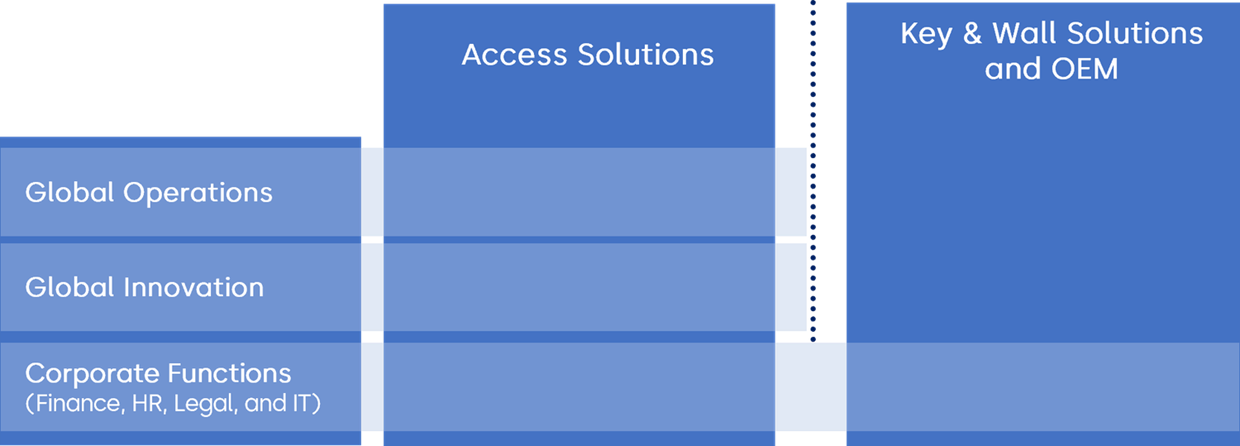
Global Innovation is responsible for delivering customer- and market-oriented product and solution developments and innovations. In cooperation with the Global Commercial function, it develops and steers innovations and technology strategies to foster dormakaba’s innovation leadership in the market.
Corporate Functions (Finance, HR, Legal, and IT) globally support the above business units and functions to steer the business, drive strategic initiatives, and strengthen the companyʼs customer centricity.
Organizational segment structure
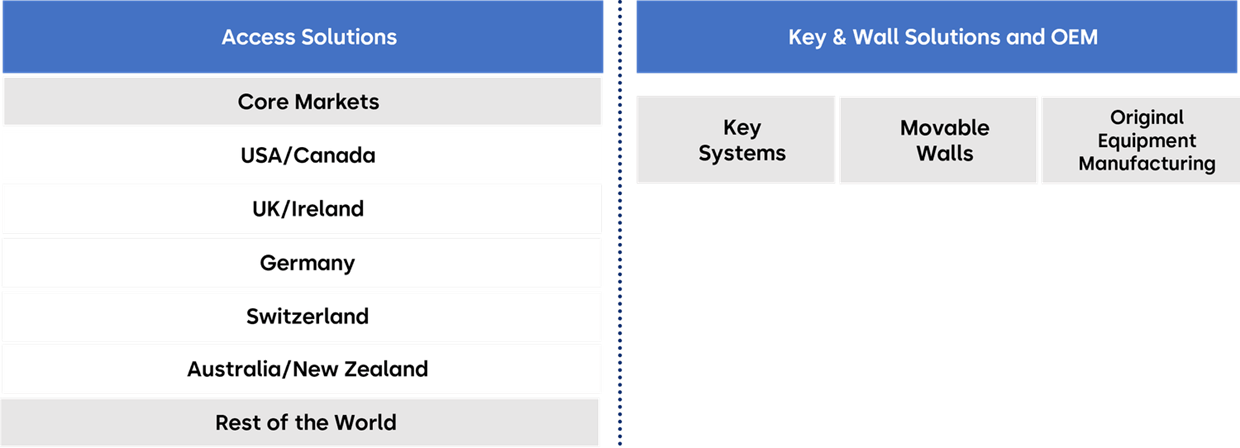
Financial performance is assessed by Group management across two operating segments; Access Solutions and Key & Wall Solutions and OEM (KWO). Within Access Solutions, performance is further monitored across the five core markets, Rest of the World, and Global Functions. Within KWO, performance is evaluated across the business units Key Systems, Movable Walls, and Original Equipment Manufacturing. As the Executive Committee assesses performance and allocates resources at the level of Access Solutions and KWO, segment reporting is presented on the same basis up to adjusted EBIT contribution. Financial transactions of Global Functions that are directly attributable to, or can be reasonably allocated to, a specific segment are reported within the respective segment. To enhance financial steering, transparency, and accountability, the performance of the core markets is measured based on their full contribution to the Group’s results. Segment results are prepared using the same accounting principles as those applied in determining the Group’s operating profit. Intersegment transactions are conducted on an arm’s length basis.
Offering
dormakaba Group provides smart, secure, and sustainable solutions for seamless flow and integrated access. Its portfolio of strong brands offers customers the full range of products, solutions, and services for access to premises, buildings, and rooms. From award-winning, end-to-end access solutions to industry best practices and straightforward installation across a range of markets and industries, dormakaba is a complete partner for door and access systems, catering to a broad range of industries such as hotels, retail spaces, sporting venues, airports, hospitals, offices, utilities, and multi-housing, as well as selected residential markets.
With a clear portfolio segmentation, dormakaba focuses on its global core businesses Access Automation Solutions (door operators, sliding doors, and revolving doors), Access Control Solutions (connected devices and engineered solutions), Access Hardware Solutions (door closers, exit devices, and mechanical key systems) and Services. The Group is also a market leader for Key Systems (key blanks, key cutting machines, and automotive solutions such as transponder keys and programmers), as well as Movable Walls, including acoustic movable partitions and horizontal and vertical partitioning systems.
Segment reporting
|
|
|
Access Solutions |
|
Key & Wall Solutions and OEM |
|
Corporate |
|
Eliminations |
|
Group |
||||||||||
|
CHF million |
|
Financial year ended 30.06.2026 |
|
Financial year ended 30.06.2025 |
|
Financial year ended 30.06.2026 |
|
Financial year ended 30.06.2025 |
|
Financial year ended 30.06.2026 |
|
Financial year ended 30.06.2025 |
|
Financial year ended 30.06.2026 |
|
Financial year ended 30.06.2025 |
|
Financial year ended 30.06.2026 |
|
Financial year ended 30.06.2025 |
|
Net sales third parties |
|
2,371.5 |
|
2,432.4 |
|
420.9 |
|
437.7 |
|
0.0 |
|
0.0 |
|
|
|
|
|
2,792.4 |
|
2,870.1 |
|
Intercompany sales |
|
5.7 |
|
8.3 |
|
47.7 |
|
50.7 |
|
0.0 |
|
0.0 |
|
–53.4 |
|
–59.0 |
|
0.0 |
|
0.0 |
|
Total sales |
|
2,377.2 |
|
2,440.7 |
|
468.6 |
|
488.4 |
|
0.0 |
|
0.0 |
|
–53.4 |
|
–59.0 |
|
2,792.4 |
|
2,870.1 |
|
Adjusted EBIT (Adjusted operating profit) |
|
332.1 |
|
318.7 |
|
86.1 |
|
89.7 |
|
–50.0 |
|
–42.3 |
|
|
|
|
|
368.2 |
|
366.1 |
|
as % of sales |
|
14.0% |
|
13.1% |
|
18.4% |
|
18.4% |
|
0.0% |
|
0.0% |
|
|
|
|
|
13.2% |
|
12.8% |
|
Adjusted depreciation and amortization |
|
65.6 |
|
63.9 |
|
13.2 |
|
13.0 |
|
2.0 |
|
2.0 |
|
|
|
|
|
80.8 |
|
78.9 |
|
Adjusted EBITDA (Adjusted operating profit before depreciation and amortization) |
|
397.7 |
|
382.6 |
|
99.3 |
|
102.7 |
|
–48.0 |
|
–40.3 |
|
|
|
|
|
449.0 |
|
445.0 |
|
as % of sales |
|
16.7% |
|
15.7% |
|
21.2% |
|
21.0% |
|
0.0% |
|
0.0% |
|
|
|
|
|
16.1% |
|
15.5% |
|
Net working capital |
|
600.4 |
|
598.2 |
|
86.8 |
|
91.2 |
|
–31.8 |
|
–28.6 |
|
|
|
|
|
655.4 |
|
660.8 |
|
Capital expenditure |
|
71.4 |
|
74.2 |
|
13.8 |
|
13.3 |
|
42.5 |
|
22.8 |
|
|
|
|
|
127.7 |
|
110.3 |
|
Average number of full-time equivalent employees |
|
11,547 |
|
11,752 |
|
3,361 |
|
3,253 |
|
402 |
|
420 |
|
|
|
|
|
15,310 |
|
15,425 |
Reconciliation of operational figures
|
|
|
Financial year ended 30.06.2026 |
|
Financial year ended 30.06.2025 |
||||||||
|
CHF million |
|
Adjusted |
|
IAC 1 |
|
Unadjusted |
|
Adjusted |
|
IAC 1 |
|
Unadjusted |
|
Operating profit before depreciation and amortization (EBITDA) |
|
449.0 |
|
–53.3 |
|
395.7 |
|
445.0 |
|
–44.7 |
|
400.3 |
|
Depreciation and amortization |
|
–80.8 |
|
–28.4 |
|
–109.2 |
|
–78.9 |
|
–24.7 |
|
–103.6 |
|
Operating profit (EBIT) |
|
368.2 |
|
–81.7 |
|
286.5 |
|
366.1 |
|
–69.4 |
|
296.7 |
1 The content of items affecting comparability (IAC) is described in the note on alternative performance measures (APM) (5.2).
1.2 Net sales per geographical market/business unit
|
CHF million |
|
Financial year ended 30.06.2026 |
|
Financial year ended 30.06.2025 |
|
Net sales third parties |
|
|
|
|
|
USA/Canada |
|
687.2 |
|
721.5 |
|
UK/Ireland |
|
94.7 |
|
109.4 |
|
Germany |
|
354.3 |
|
344.9 |
|
Switzerland |
|
229.9 |
|
219.8 |
|
Australia/New Zealand |
|
192.0 |
|
198.3 |
|
Rest of the World |
|
813.4 |
|
838.5 |
|
Total Access Solutions |
|
2,371.5 |
|
2,432.4 |
|
Key & Wall Solutions and OEM |
|
420.9 |
|
437.7 |
|
Group |
|
2,792.4 |
|
2,870.1 |
1.3 Personnel expenses
|
CHF million |
|
Financial year ended 30.06.2026 |
|
Financial year ended 30.06.2025 |
|
Personnel expenses |
|
1,110.6 |
|
1,145.2 |
|
Salaries and wages |
|
887.2 |
|
914.8 |
|
Social security expenses |
|
180.3 |
|
183.4 |
|
Share-based payments |
|
11.4 |
|
5.3 |
|
Pension benefit expenses (see note 2.5) |
|
28.5 |
|
30.4 |
|
Employment termination expenses |
|
2.2 |
|
10.2 |
|
Other benefits |
|
1.0 |
|
1.1 |
|
Number of full-time equivalent employees |
|
Financial year ended 30.06.2026 |
|
Financial year ended 30.06.2025 |
|
Employees at balance sheet date |
|
15,347 |
|
15,346 |
|
Average number of employees per functions and business units |
|
15,310 |
|
15,425 |
|
Total Access Solutions |
|
11,547 |
|
11,752 |
|
Commercial and Marketing |
|
7,017 |
|
7,076 |
|
Operations |
|
3,078 |
|
3,171 |
|
Innovation |
|
726 |
|
716 |
|
Finance and HR |
|
726 |
|
789 |
|
Key & Wall Solutions and OEM |
|
3,361 |
|
3,253 |
|
Corporate |
|
402 |
|
420 |
|
Average number of employees per geographical region |
|
15,310 |
|
15,425 |
|
Switzerland |
|
890 |
|
871 |
|
Germany |
|
2,724 |
|
2,779 |
|
Rest of EMEA |
|
4,033 |
|
4,019 |
|
Americas |
|
3,394 |
|
3,484 |
|
Asia Pacific |
|
4,269 |
|
4,272 |
Share-based payments
The Nomination and Compensation Committee is responsible for nominating individual members of the Executive Committee (EC) and other Senior Management members for long-term incentive (LTI) awards. The LTI award is granted through a Performance Share Unit (PSU) plan, vesting over three years and subject to the achievement of performance conditions. During the reporting period, the LTI grants include performance indicators such as relative Total Shareholder Return (TSR), Earnings per Share (EPS), and Sustainability (ESG) related targets. Sustainability targets have been introduced as from the grant 2023 to reflect the increasing importance of sustainability and cover both social and environmental topics that are addressed by our sustainability strategy. The vesting level may range from 0% to a maximum of 200% of the original number of units granted (maximum two shares for each performance share unit originally granted); there is no vesting below the threshold levels of performance.
The fair value of the Performance Share Units (PSUs) at the grant date includes adjustments for foregone dividends during the vesting period and the Total Shareholder Return (TSR) performance condition. The associated expenses are recognized on a straight-line basis over the vesting period. The restricted shares allocated to the members of the Board of Directors (BoD) are blocked for three years.
The fair value of the restricted shares corresponds to the value of the closing price of the dormakaba Holding AG share on the SIX Swiss Exchange as at the business day prior to the date of the allocation.
Further information about the allocation of treasury shares is disclosed in the note on share capital and treasury shares (3.2), and further details about long-term incentive stock award plans are outlined in the Compensation Report.
1.4 Other operating expenses
|
CHF million |
|
Financial year ended 30.06.2026 |
|
Financial year ended 30.06.2025 |
|
Total other operating expenses |
|
–36.3 |
|
–28.1 |
|
Goodwill amortization |
|
–28.0 |
|
–24.7 |
|
Loss from sale of subsidiaries |
|
–7.4 |
|
–2.1 |
|
Other operating expenses |
|
–0.9 |
|
–1.3 |
1.5 Financial result
|
CHF million |
|
Financial year ended 30.06.2026 |
|
Financial year ended 30.06.2025 |
|
|
Financial income |
|
|
2.2 |
|
3.0 |
|
Interest income |
|
|
2.0 |
|
2.8 |
|
Other financial income |
|
|
0.2 |
|
0.2 |
|
Financial expense |
|
|
39.3 |
|
46.3 |
|
Interest expenses for bonds |
|
14.2 |
|
13.7 |
|
|
Interest expenses for forward contracts |
|
11.4 |
|
14.0 |
|
|
Other interest expenses |
|
|
6.8 |
|
6.2 |
|
Foreign exchange losses (gains) |
|
2.8 |
|
6.9 |
|
|
Other financial expenses |
|
|
4.1 |
|
5.5 |
1.6 Taxes
Income taxes
The weighted applicable tax rate results from applying each subsidiary’s statutory income tax rate to the income before taxes. Since the Group operates in countries that have different tax rates, the weighted applicable tax rate may vary from year to year according to variations in income per country and changes in applicable tax rates.
|
CHF million |
|
Financial year ended 30.06.2026 |
|
Financial year ended 30.06.2025 |
|
Profit before taxes |
|
249.4 |
|
253.3 |
|
Weighted applicable tax rate |
|
24.4% |
|
24.6% |
|
Tax calculated at applicable tax rate |
|
60.8 |
|
62.3 |
|
Current income taxes |
|
46.5 |
|
58.0 |
|
Deferred income taxes |
|
17.7 |
|
7.3 |
|
Income taxes |
|
64.2 |
|
65.3 |
|
Difference between applicable and effective income taxes |
|
3.4 |
|
3.0 |
|
Impact of losses and tax loss carryforwards |
|
–0.8 |
|
–6.5 |
|
Tax-exempt income |
|
–3.6 |
|
–4.8 |
|
Non-deductible expenses |
|
5.2 |
|
6.7 |
|
Impact from divestments/goodwill |
|
–2.4 |
|
2.9 |
|
Non-recoverable withholding tax expenses |
|
5.0 |
|
6.5 |
|
Effect of change in tax rates |
|
3.0 |
|
–0.2 |
|
Tax charges (credits) relating to prior periods, net |
|
–2.1 |
|
–1.0 |
|
Other |
|
–0.9 |
|
–0.6 |
|
Income taxes charged to equity |
|
0.3 |
|
0.0 |
The effective income tax rate of 25.7% (2024/25: 25.8%) was affected by several goodwill-related items and divestments. While certain goodwill expenses are not deductible for tax purposes and therefore increase the effective tax rate, the Group also recognized an additional deferred tax asset relating to future tax deductions in North America. This overall benefit was partly compensated by the change in tax rates, mainly the staged tax rate reduction in Germany from around 31.8% to 26.5% until 2031/32. Further, the prior year's tax expense benefited from the utilization of tax losses arising from restructuring costs. Consistent with the Group's accounting policy, no deferred tax assets are recognized for such tax losses. Overall, the net impact of these items on the effective tax rate was broadly comparable in the current and prior year.
Deferred taxes
|
CHF million |
|
Financial year ended 30.06.2026 |
|
Financial year ended 30.06.2025 |
|
Balance sheet presentation of deferred income taxes |
|
|
|
|
|
Total deferred income taxes, net |
|
79.9 |
|
97.2 |
|
Deferred income tax assets |
|
103.7 |
|
118.9 |
|
Deferred income tax liabilities |
|
23.8 |
|
21.7 |
|
Expiration of tax loss carryforwards not recognized as deferred tax assets |
|
|
|
|
|
Balance of tax loss carryforwards at end of financial year |
|
118.7 |
|
121.5 |
|
Expiry in 1 year |
|
0.4 |
|
3.3 |
|
Expiry in 2 to 5 years |
|
6.4 |
|
9.5 |
|
Expiry after 5 years |
|
3.3 |
|
7.2 |
|
No expiry |
|
108.6 |
|
101.5 |
The unrecognized tax loss carryforwards of CHF 118.7 million (2024/25: CHF 121.5 million) have the potential to generate tax relief of CHF 29.2 million (2024/25: CHF 28.7 million). Over the medium term, it is anticipated that up to CHF 5.9 million (2024/25: CHF 4.3 million) of the potential tax relief may be realized.
OECD Pillar Two income taxes
In December 2021, the OECD published the Pillar Two model rules to introduce a global minimum corporate income tax of 15% for multinational companies with revenues of more than EUR 750 million. Meanwhile, Pillar Two legislation has been enacted or substantially enacted in many jurisdictions in which dormakaba operates.
The Group became subject to the global minimum tax as of the financial year beginning 1 July 2024. The majority of dormakaba’s operating jurisdictions benefit from the transitional CbCR safe harbor, including the jurisdictions in our core markets. A current tax expense of around CHF 0.3 million for the year ended 30 June 2026 has been recognized related to top-up taxes in the UAE.
dormakaba does not recognize or disclose any information on deferred income tax assets and liabilities related to the OECD Pillar Two global minimum corporate income tax.