Energy & Emissions
We are demonstrating leadership in the transition to a low-carbon economy within the industry and beyond.
Our approach
The emission of greenhouse gases (GHG), which are generated through the burning of fossil fuels, is one of today’s biggest challenges. Every business, government, and individual has a role to play in meeting the goals of the Paris Agreement. We understand the risks posed by climate change, and we are taking action to reduce our energy consumption and related emissions to strive for a low-carbon economy. We use the latest scientific knowledge to guide a sound management approach, and our emission reduction targets have been validated by the Science Based Targets initiative (SBTi).
Our energy consumption and GHG emission reduction program is part of our global Environment Directive. Furthermore, our Environment, Health & Safety, and Sustainable Products Expert Groups are developing and implementing initiatives to achieve the related targets. One such target is the establishment of energy management systems at our manufacturing sites, which is key to managing and reducing our energy consumption. As of 30 June 2023, 35% of our plants, local assembly centers, and regional logistics centers have established energy management systems (which is the same as in the previous financial year).
Our contribution to the fight against climate change
In 2021, the SBTi approved our targets for operational and value chain emissions. We aim to reduce operational (Scope 1+2) emissions by at least 42% in line with a 1.5°C future by 2030, without the use of carbon offsets (baseline 74,770 tCO2e in FY 19/20). Any residual emissions will be voluntarily compensated through Gold Standard offsets to achieve our target of becoming carbon neutral by 2030. We also aim to reduce our value chain emissions (Scope 3) from purchased goods and services, and the use of sold products by 25% by 2030 (baseline 1,124,936 tCO2e in FY 19/20). Progress against the operational emissions target is being tracked as part of our sustainability-linked credit facility.
Many components used to create our products are manufactured in-house through processes including melting, aluminum and zinc die casting, machining, purchased parts processing, and final assembly. The aforementioned processes also require controlled, HVAC conditioned space for process control, labor efficiency, and maintenance of a healthy working environment. Together, these processes drive our total energy demand. As a result, we are focusing many of our energy-saving initiatives in this area. In line with our science-based emission reduction targets, we aim to reduce the energy intensity of our operations by 25% by 2030 (baseline 100.5 MWh/mCHF in FY 19/20).
To achieve our ambitious targets, we are focusing on the following activities:
- Investing in energy efficiency projects
- Increasing on-site production of solar power
- Purchasing electricity from renewable sources
- Electrifying our fleet
- Improving the energy efficiency of our products in the use phase
Our climate transition plan
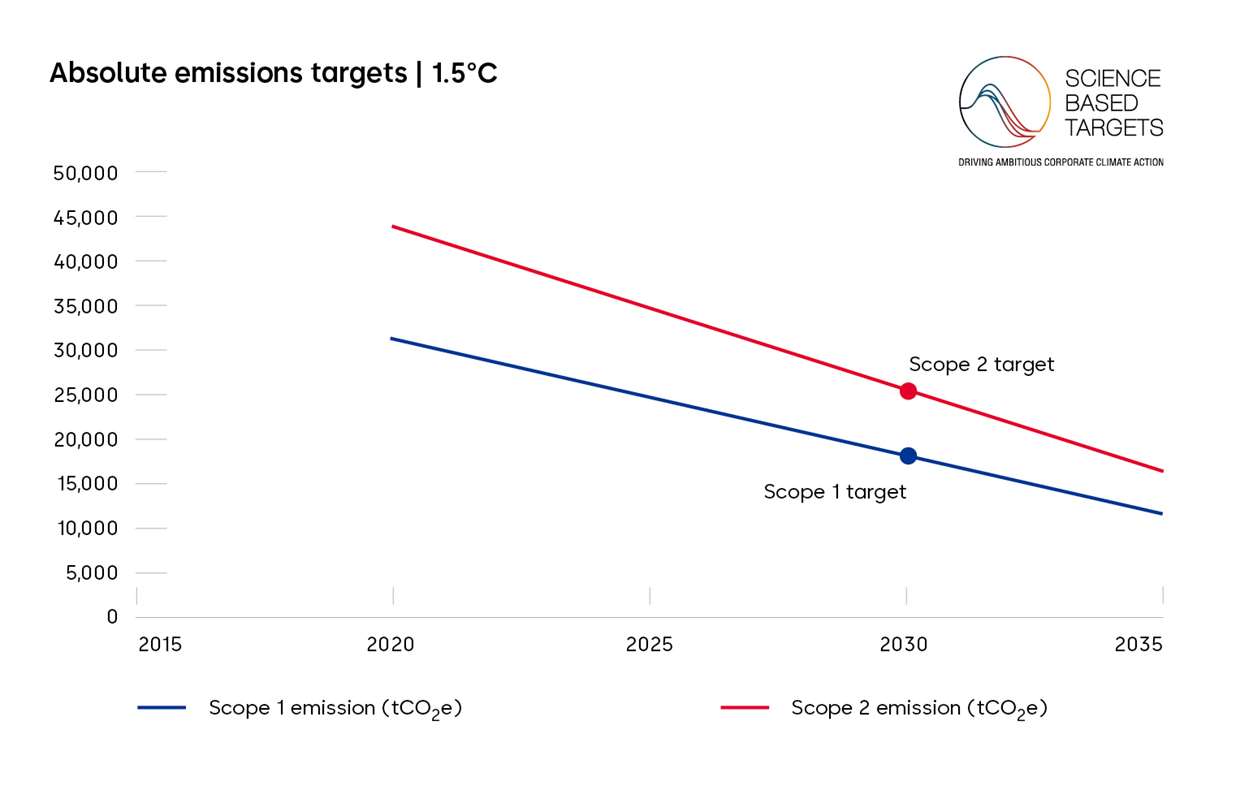
We are opening the doors wide to a low-carbon economy. In fact, we aim to be net zero by 2050 at the latest. As a first concrete milestone, we have set a target to reduce our operational emissions (Scope 1+2) by 42% in line with a 1.5°C future by 2030 (baseline 74,770 tCO2e in FY 19/20). Additionally, we will reduce value chain emissions (Scope 3) by 25% over the same time frame. Let’s look closer at our Scope 1+2 targets.
Absolute emissions targets: Scope 1+2
Approved by the Science Based Targets initiative (SBTi), our target is to reduce absolute Scope 1+2 greenhouse gas (GHG) emissions by 42% by 2030. This means annual emissions savings of 43,366 tCO2e.
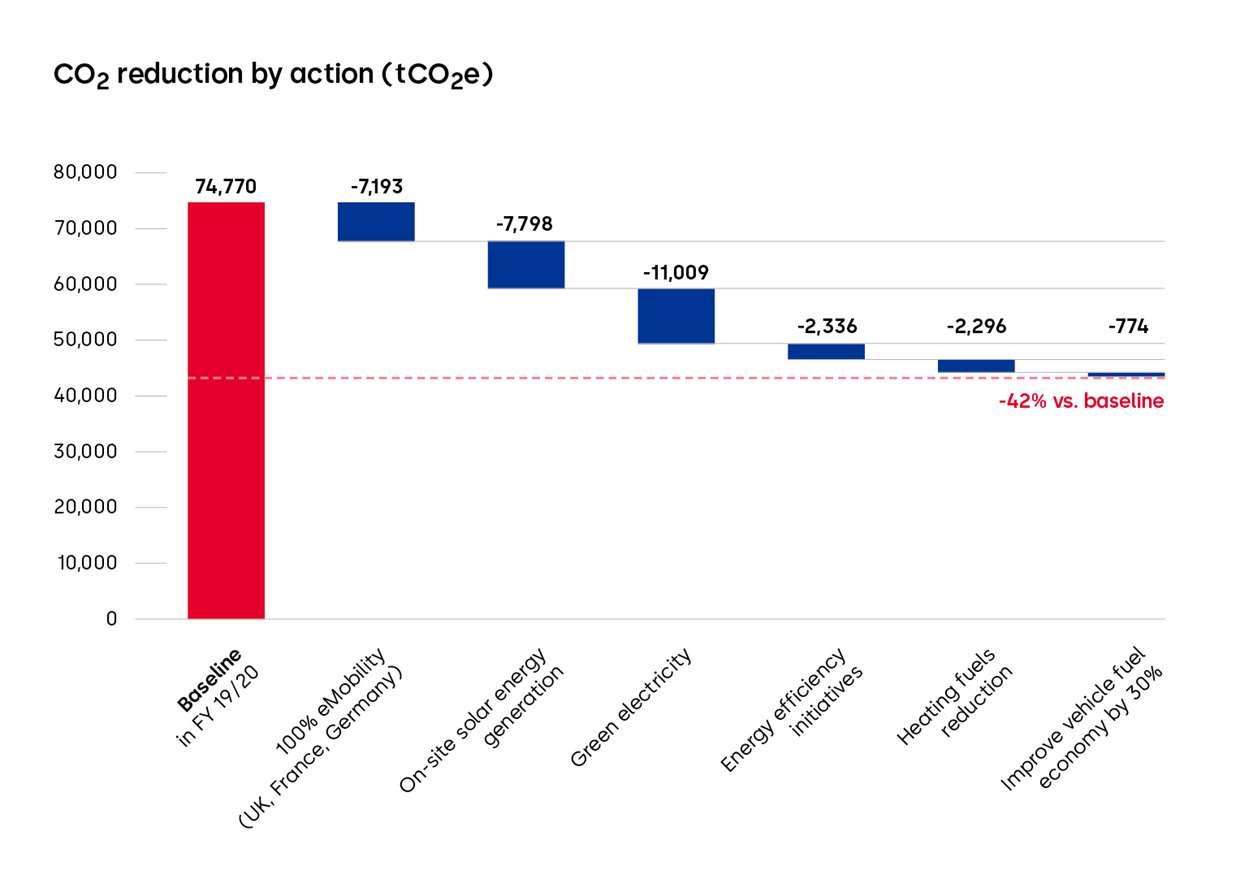
Our strategy
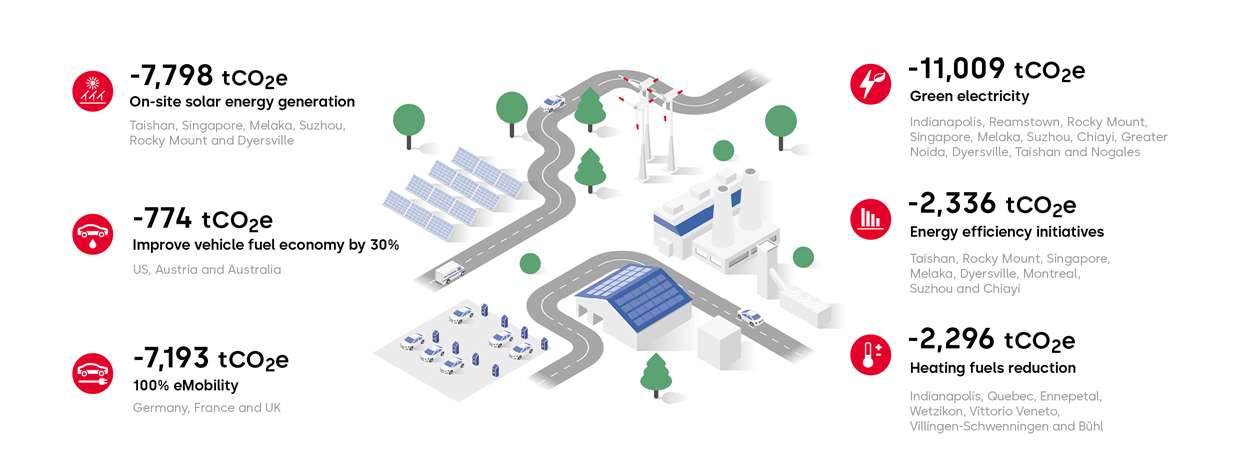
To achieve the 42% reduction (43,366 tCO2e), we have set Must-Have initiatives along six levers, that must be completed by 2030. These initiatives will be executed at dormakaba sites, where we can have the largest impact on reducing our CO2 emissions.
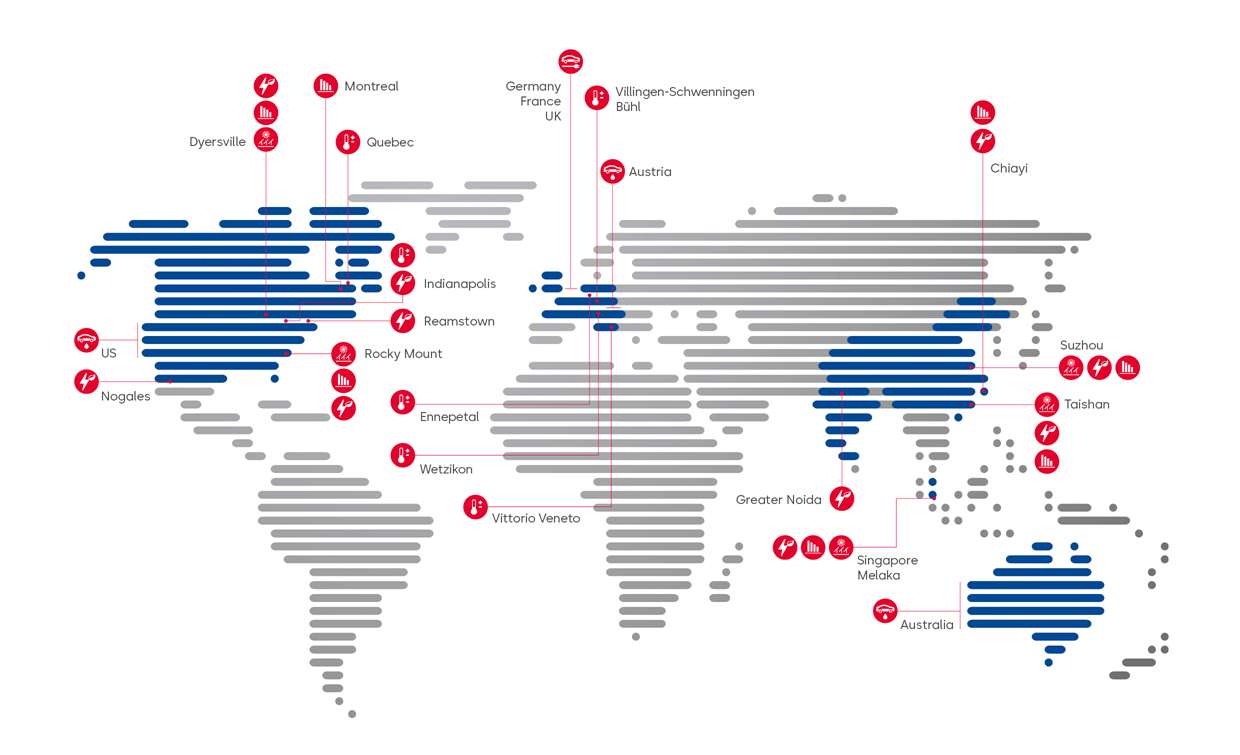
dormakaba locations around the world with Must-Have initiatives
We welcome stakeholder feedback, questions, or suggestions related to our climate transition plan. Should you like to share your opinion, kindly send an email to sustainability@dormakaba.com
Our performance
Greenhouse gas emissions
In FY 22/23, our total greenhouse gas (GHG) emissions (Scope 1+2) amounted to around 64,600 tCO2e. Nearly 54% were emitted as a consequence of electricity consumption, followed by vehicle and heating fuel consumption, and volatile as well as process gas emissions. Climate-related initiatives implemented during the reporting year resulted in total annual savings of approximately 17,300 tCO2e (nearly 27% of our total footprint from own operations).
Thanks to the implementation of the energy-saving initiatives outlined in the next section, we expect to reduce our annual GHG emissions by approximately 1,500 tCO2e. We have worked diligently to source renewable electricity or generate our own renewable energy where feasible, leading to annual emissions avoidance of approximately 15,800 tCO2e. In addition, we have expanded the production of on-site solar energy by 50%.
During FY 22/23 we increased the generation of solar energy at our sites. Since January 2023, we have generated enough solar energy on site to cover 100% of the electricity needs at our manufacturing site in Chennai (India). The installation is equipped with 440 solar panels with a capacity of 240 kilowatts peak (kWp). Furthermore, at our facility in Wah Yuet (China) we have begun the construction of a large-scale solar installation with a total planned capacity of 9,500 kWp that will provide 9,050 MWh green electricity annually. With this, we plan to avoid 5,671 tons of CO2 emissions per year for the lifetime of the installation (25 years).
Our Key & Wall Solutions factories in Senai (Malaysia) and Greater Noida (India) also consume energy from their own solar installations, covering 42% and 15% of their electricity needs respectively. In FY 22/23 Vittorio Veneto installed 3,189 panels and 12 inverters for peak output of 1,308 kWp, producing 1,539 MWh per year. This last installation does not, however, reduce our baseline emissions, as the location already consumed renewable energy before. Still, the initiative does contribute to our energy independence.
Greenhouse gas emissions by source (tCO2e)

Scope 1 and Scope 2 greenhouse gas emissions (tCO2e)1

- Greenhouse gas inventory calculated in accordance with the WRI/WBCSD Greenhouse Gas Protocol. Emission factor sources: UK Defra (2019), US EPA eGRID (2018), IEA (2019), AIB (2018).
- Scope 1: direct greenhouse gas emissions from sources owned or controlled by dormakaba.
- Scope 2: indirect greenhouse gas emissions from sources owned or controlled by another entity, as a consequence of the company’s activities.
- Biogenic emissions associated with the combustion of biofuel amount to 73 tCO2e. These are called “outside of scopes" emissions and reflect the impact of burning biomass and biofuels. The fuel source itself absorbs an equivalent amount of CO2 during the growth phase to that released through combustion.
- The greenhouse gas emissions associated with electricity consumption are reported according to the “market-based approach”, as defined in the Greenhouse Gas Protocol Scope 2 Guidance.
Year-on-year absolute Scope 1+2 emissions (tCO2e)

Scope 3 emissions constitute around 90% of our combined Scope 1, 2, and 3 carbon emissions, highlighting the importance of Scope 3 emissions for our climate strategy. In FY 19/20, we carried out screening and carbon inventory development of Scope 3 emissions, which showed that the largest sources of Scope 3 emissions are purchased goods and services (75%) and the use phase of sold products (11%). For FY 22/23, value chain emissions for the use phase of products totaled 198,900 tCO2e. As mentioned, value chain emissions from purchased goods and services represent the vast majority, totaling 928,600 tCO2e in the reporting period. In FY 22/23 we saw an increase in procurement spend vs. the previous year, as well as an increase in purchases of more carbon-intensive metals. While emissions stemming from purchased goods and services has risen, those from product use have decreased. Overall, these have offset each other over the past two years, and which means we are thus still close to the baseline figure.
Scope 3 emissions: purchased goods and services (tCO2e)1, 2

Scope 3 emissions: use phase of products (tCO2e)3

Year-on-year absolute Scope 3 emissions (tCO2e)

Digital energy calculator for the product use phase
In terms of primary energy consumption, the building sector is one of the largest energy users in the world – as a result, its influence on climate change is enormous. Therefore, we have set a target of having best in class energy efficiency for new products by 2023. Our digital Product CO2 Inventory Tool supports us in this as it provides information on the carbon emissions of energy-consuming products during their use phase (the calculation method is in line with the GHG Protocol). The tool includes the footprint of around 350 products that consume energy after installation, including those that are battery-operated or connected to the electricity grid. This supports product development and optimization activities to create more energy-efficient products and also contributes to our target of decreasing Scope 3 emissions from the use phase of sold products.
Sustainable door and access solutions to improve the energy balance of buildings
Door Efficiency Calculator
During the operation of automatic entrance doors (sliding doors, swing doors), in many cases there is an unnecessary loss of heating and cooling energy. This not only increases the carbon footprint of the building but also its energy costs.
To address this issue, dormakaba launched a new consulting tool, the Door Efficiency Calculator. The tool compares different dormakaba automatic doors in terms of energy efficiency, costs, and carbon footprint. It takes into account the type of building, the usage, and the frequency of people passing through the door. This helps customers to find the most energy-efficient solutions that also meet the requirements of the building in question and its use. The calculator considers various aspects, such as the geographical location and climatic conditions, as well as the energy sources used to heat and cool the building. The calculation result is summarized in a customer-specific report showing the compared input solutionsʼ ecological and economic aspects.
Improving energy balance of the building with our smart automatic door system
Sensor-controlled automatic door systems are essential for seamless and controlled access, whether in airports, train stations, or hotels. To ensure the doors open for both slow- and fast-walking pedestrians, current solutions are based on a large detection field and long hold-open times. This leads to an average opening time of ten seconds. However, our studies show that 85% of users enter through a door in less than four seconds, which means there are six seconds of wasted time and energy loss.
To tackle this inefficiency, our sustainable product experts developed an intelligent system that opens the door only when it is actually necessary and closes it immediately after passage. The system detects the speed, distance, and angle at which a person approaches the door and reacts accordingly. This can make a significant contribution to improving the energy balance of the building and reducing operating costs. The individual adaptation of the opening and closing processes also ensures greater safety during operation. The service life of the drive technology is also extended, as unnecessary openings are avoided.
In a test scenario with a swing door (ED 100/250 operator), 3,750 kWh per year is saved, which corresponds to Scope 4 emissions of 1,372 kg CO2 (vs. 2,745 kg CO2 without the smart system).
Energy consumption
Our total energy consumption for FY 22/23 was over 239,000 MWh. Electricity and fuels for heating or manufacturing constitute 72% of total energy consumption and play a crucial role in our production processes. Fuel consumption of our vehicle fleet makes up for the remaining energy consumption.
In collaboration with our global partner Siemens, we completed Investment Grade Audits at five large plants in Region Asia Pacific and Key & Wall Solutions. This was a followup to the first phase of the project, which included value discovery audits to evaluate potential facility improvement measures. The results of the IGAs will help inform efficiency initiatives for the five plants in the upcoming years.
Additionally, energy-saving initiatives were implemented at various sites. This work included: retrofitting facilities to feature LED lighting, upgrading equipment such as air compressors, and the optimization of heating and cooling systems.
Below are some specific examples of activities from our facilities across the world in FY 22/23:
- At our manufacturing plant in Singapore, we optimized the operation of several system workloads and operating times. This includes our cooling towers, centralized chiller plant, and air handling units. By optimizing system sequencing based on capacity, efficiency, loads, automation, and optimal scheduling using our Building Management System, our plant is projected to save approximately 698 MWh or 284 tCO2e annually.
- In Fougères (France), we replaced an air compressor with a more energy-efficient model, equipped with a heat recovery system, which will contribute to heating the premises. The initiative is estimated to reduce electricity consumption by 28 MWh (2.8 tCO2) and the gas consumption by 17 MWh (3.9 tCO2) annually. Furthermore, 18 skylights were replaced to improve natural light quality, insulation, and ventilation.
- We have installed LED lights in the Westerstede (Germany) facility, saving about 5 MWh per month.
- At our facility in Greater Noida (India), we optimized the operation time of two press machines and replaced the motor of a milling machine. Together, these initiatives contribute about 1.3 MWh in energy saving monthly.
- In Vittorio Veneto (Italy), a piping system was installed to connect compressors to the factory and to use them to heat the building using recovered hot air. As a result, the site used 29,073 m2 less heating fuel in March 2023 versus the same period in 2023.
- In France we relocated our premises from Creteil Cedex and Le Mesnil-Saint Denis to a certfied green office building in Antony (NF HQE standard). During the setup of the new location, we made several responsible choices, such as buying furniture made of industrial waste, eco-designed workstations, floor coverings made of econyl (regenerated nylon), and replacing neon lights with LED lighting.
As a result of these and other activities, we realized total quantifiable annual energy savings of approximately 6,200 MWh for the sites covered within the scope of this report. In addition, over 57,800 MWh (50.3%) of the electricity that we consumed came from renewable sources.
Regarding our efforts to reduce vehicle fuels consumption and promote eMobility, we installed EV charging stations at three locations: five double stations in Hitchin (UK) and 16 in Herzogenburg and Seekirchen (Austria). Unfortunately, the planned installations in Germany did not materialize due to resource gaps in project management.
Increasing energy efficiency through the implementation of energy management systems
Energy management systems are key to managing and reducing our energy consumption. Our sites in Tocancipá (Colombia) and Lima (Peru) were among those that began the implementation of an energy management system in FY 22/23. During the planning phase, project managers took part in a global internal training and received templates and checklists that supported their work to develop the process. To start measuring the energy consumption of the industrial processes, some refurbishment was needed in the factories, including upgrading the electrical network and some insulation work. Furthermore, the electrical panels were modernized in Peru, and the heating system of the nickel baths in Colombia was replaced with a more efficient system. In addition, the project managers reorganized schedules and shifts in a way that was better aligned with the production plan to minimize the hours of usage of certain equipment.
While some of these initiatives are already contributing to increased energy efficiency, their main goal was to create an environment that made it possible to accurately measure the energy consumption of most of the production processes, and to identify what are known as the Significant Energy Users for each site. With this knowledge, operational managers are now able to identify opportunities for improvement, and put in place action plans to increase energy efficiency.
Energy use (in MWh)

Electricity by source (in %)

EU Taxonomy
The EU taxonomy allows financial and non-financial companies to share a common definition of economic activities that can be considered environmentally sustainable, in recognition of the fact that the shift of capital flows towards more sustainable activities has to be underpinned by a shared, holistic understanding of the environmental sustainability of activities and investments.
Based on the EU taxonomy technical screening criteria, a company’s internal economic activities can be classified according to their environmental sustainability. The classification system is broken down into six environmental objectives:
- Climate change mitigation
- Climate change adaptation
- Transition to a circular economy
- Pollution prevention and control
- Protection and restoration of biodiversity and ecosystems
- Sustainable use and protection of water and marine resources
Economic activities that have the potential to contribute to one of the environmental objectives are referred to as taxonomy-eligible. Those taxonomy-eligible activities that are actually environmentally sustainable are referred to as taxonomy-aligned. Taxonomy alignment requires fulfillment of the following three criteria sets:
- Substantial contribution to one of the six environmental objectives
- No significant harm regarding the other five environmental objectives (Do No Significant Harm, DNSH)
- Compliance with minimum social and governance requirements (minimum safeguards)
Articles 3 and 9 of Taxonomy Regulation (EU) 2020/852 (Taxonomy) require dormakaba to disclose sales, capital expenditure (CapEx), and operating expenditure (OpEx) related to environmentally sustainable economic activities. In this reporting year, taxonomy eligibility and taxonomy alignment must be reported for the first two environmental objectives.
A review of EU taxonomy requirements and technical screening criteria against the full scope of our products and solutions was conducted together with the Product Sustainability department and Product Managers. It was found that the EU taxonomy classification is largely not applicable to the majority of our revenue-generating activities – nor to that of the access solutions industry in general. Eligibility was found only under the Taxonomy Report Technical Annex 1, section 3.5. Manufacture of energy efficiency equipment for buildings; relating to “doors with U-value lower or equal to 1.2 W/m2K”. Revenues from all doors that could be installed as external doors were therefore defined as eligible. Product management then reported the U-values for all such doors to determine taxonomy alignment.
In addition to revenue-relevant activities, cross-cutting activities to which only capital and operating expenditures are attributed were also considered, such as solar PV projects, electric vehicle charging installations, and energy efficiency initiatives. These are related to sections 4.1 Electricity generation using solar photovoltaic technology, 7.3. Installation, maintenance, and repair of energy efficiency equipment, 7.4. Installation, maintenance, and repair of charging stations for electric vehicles in buildings (and parking spaces attached to buildings), and 7.5. Installation, maintenance, and repair of instruments and devices for measuring, regulation, and controlling energy performance of buildings in the aforementioned annex.
The investment and spend values were taken into account only for those initiatives that are eligible and/or aligned and that are tracked and controlled in our global Sustainability Initiatives tracker tool to ensure against double counting. A due diligence assessment versus the minimum safeguards and DNSH criteria was undertaken by our Human Rights function.
|
|
|
Taxonomy-aligned |
|
Taxonomy-eligible but not aligned |
|
Taxonomy-eligible |
|
Taxonomy non-eligible |
|
Turnover 1 |
|
0.05% |
|
1.78% |
|
1.83% |
|
98.17% |
|
CapEx 2 |
|
0.2% |
|
0.0% |
|
0.2% |
|
99.8% |
|
OpEx 3 |
|
0.0% |
|
0.0% |
|
0.0% |
|
100.0% |
1 Turnover (eligible): Net sales from external doors; Turnover (aligned): Net sales from doors with a thermal efficiency U-value of less than or equal to 1.2 W/m 2 K
2 CapEx includes: CapEx for generation of renewable energy (e.g. solar power installations); CapEx for energy efficiency initiatives; CapEx for electric vehicle charging points, plug-in hybrids, and full-electric vehicles in the fleet
3 OpEx includes: OpEx for energy efficiency projects
Outlook
On a central level, we will focus on completing the solar installation at our plant in Taishan (China) and begin construction of solar installations for our plants in Singapore, Suzhou (China), and Melaka (Malaysia). And in our plant in Indianapolis (USA) we will also improve HVAC energy efficiency by replacing two air rotation units.