Climate Change
We are demonstrating leadership in the transition to a low-carbon economy within the industry and beyond.
Our approach
We are committed to facilitating the transition to a low-carbon economy by aligning our strategy and business model with the goal of limiting global warming to 1.5°C. We see two ways to make this happen: one, by directly ensuring the efficiency of our own operations; two, by indirectly helping to reduce the carbon footprint of the buildings and projects to which we supply our products.
The integration of the sustainability governance and risk management framework into the company’s overall Shape to Growth strategy and decision-making processes described in the Governance and Sustainability Risk Management sections of this Report (see: General Information) extends to climate-related risks and opportunities, metrics, and target setting.
We use the latest scientific knowledge to guide a sound management approach, and our emission reduction targets have been validated by the Science Based Targets initiative (SBTi). Both our operational (Scope 1+2) and value chain (Scope 3) targets were approved by the SBTi in 2021.
Our energy consumption and GHG emission reduction program is part of our global Environment Directive. Furthermore, our Environment, Health & Safety, and Sustainable Products Expert Groups — as well as local management teams and QHSE staff — are developing and implementing initiatives to achieve the related targets.
Climate scenario analysis
dormakaba is dedicated to integrating climate-related risks and opportunities into our company-wide strategic decision-making. This approach not only helps us to maintain our competitive edge and prepare for the future but also signals our commitment to meeting the needs and expectations of stakeholders and society. In short, doing the right thing for the planet benefits everyone.
As part of our broader risk management framework, we have identified material risks and opportunities, not least those related to climate change (see Sustainability Risk Management section).
Transition scenario analysis
A turning point in our efforts to reduce our carbon footprint came when we conducted an in-depth scenario analysis of our business with a focus on climate change mitigation. We mapped this analysis on to business decisions, financial plans and capital allocation as a means of identifying climate-related risks and feasible opportunities.
We can break down the scenario analysis into three primary activities related to transition risk:
- Identifying current and future risks and opportunities relating to the transition to more environmentally friendly material flows (in alignment with our risk assessment framework)
- Calculating the financial impact that these risks and opportunities could have and how they may influence dormakaba’s financial planning and operational strategy
- Evaluating the main transition risks and opportunities based on two distinct emissions scenarios across three time frames: short-term (0–1 years), medium-term (1–3 years) and long-term (3–15 years). The long-term time frame currently deviates from our broader risk management process, which formally looks at short-term and medium-term time frames. The two scenarios mentioned are based on frameworks from the Network of Central Banks and Supervisors for Greening the Financial System (NGFS):
- Nationally Determined Contributions (NDCs) assumes that the conditional NDC commitments are implemented in full and that the energy and emissions targets will be reached in every country in 2025 and again in 2030, leading to a global warming rate of approximately 2.6°C.
- Divergent Net Zero assumes that the world will reach net-zero emissions by around 2050, albeit with higher costs due to divergent policies introduced across sectors, leading to a quicker phase-out of oil. Under this scenario, global warming will be limited to 1.5°C, in accordance with the Paris Agreement.
Physical climate scenario analysis
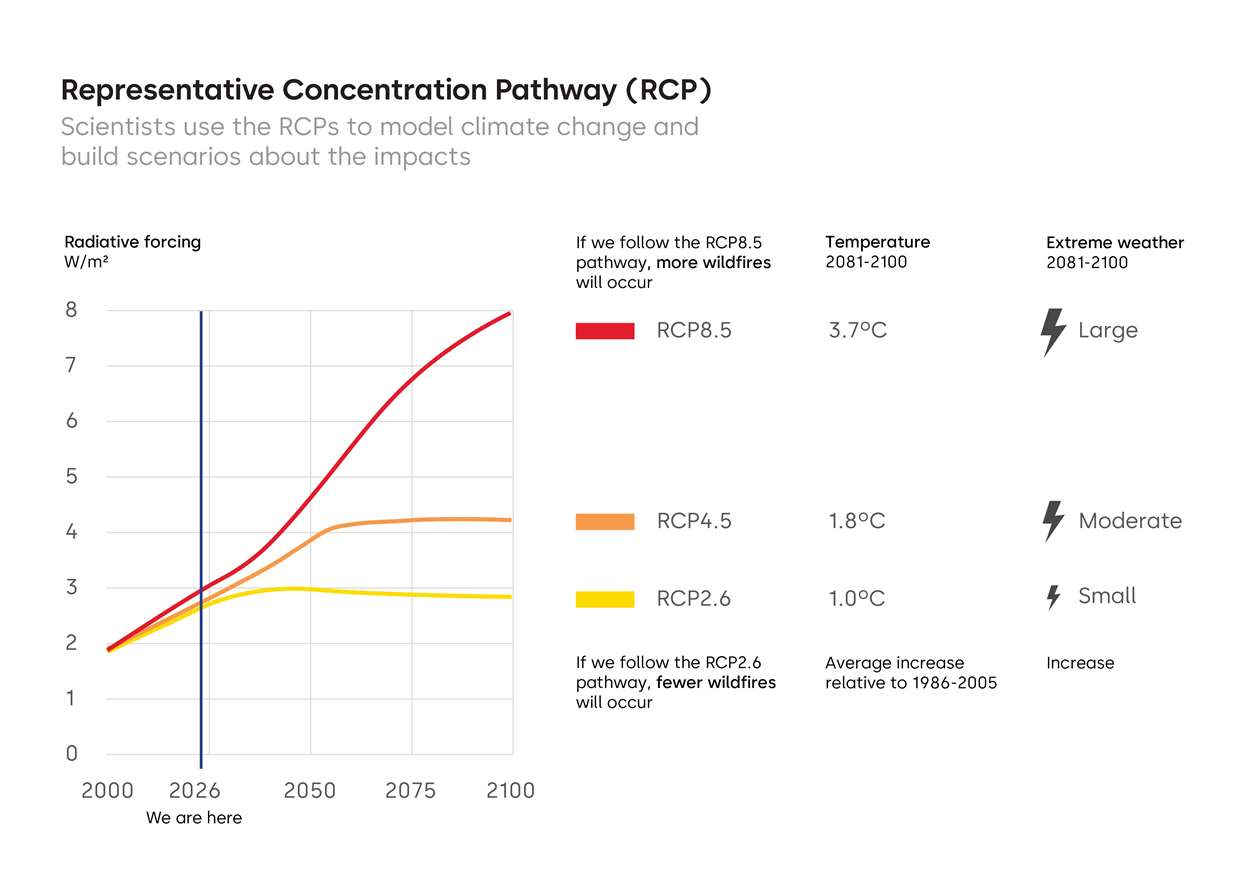
In FY 23/24 we conducted a first climate scenario analysis into the physical risk profile (whether acute or chronic) of our operations to identify both vulnerabilities and adaptation opportunities, and make strategic decisions to boost our resilience across all aspects of the business. The assessment was based on climate model projections presented by the following three Representative Concentration Pathways (RCPs):
- RCP2.6: Aggressive mitigation assumes global annual GHG emissions will peak between 2010 and 2020, with emissions declining substantially after this point.
- RCP4.5: Strong mitigation assumes emissions will peak around 2040, after which they will decline.
- RCP8.5: Business-as-usual assumes emissions will continue to rise throughout the 21st century.
Each pathway predicts future greenhouse gas concentrations caused by human activities, with varying degrees of physical impact. Since the initial assessment, an annual review is conducted on the basis of RCP8.5.
The measures we have derived from our scenario analysis approach incorporate both the financial side of our business and our operational strategy. The idea is to integrate climate-related and risk management initiatives into all our solutions and processes, as this will allow us to become more resilient as a company in the long term — and help our customers become more sustainable, too.
Climate-related risks and opportunities
Transition risks and opportunities
As the world shifts towards a low-carbon, climate-friendly future, our business will need to overcome a range of societal and economic challenges. With this in mind, we conducted a literature review as well as several interviews and workshops with colleagues from our risk, strategy, operations and sustainability teams to identify key climate transition risks and opportunities. After drawing up a long-list of related risks, we settled on six transition risk clusters and assessed their individual impacts:
- Financial and investment: The transition to a low-carbon economy will require investments in research and development. Having sufficient access to financing and investment will likely accelerate the pace of this transition (with reduced financing having the opposite effect).
- Markets: Volatile energy and raw material prices projected based on both emissions scenarios are expected to have a tangible impact on dormakaba’s suppliers and our own production costs.
- Technology: Breakthrough technologies can help reduce company and downstream GHG emissions, improve the carbon performance and marketability of products, and deliver gains in cost efficiency, operational performance, energy efficiency, and reliability. However, rapid technological advancement also intensifies competition across the industry and may create risks for companies that fail to innovate or adapt quickly.
- Legal: dormakaba may face legal challenges from regulators or other parties alleging non-compliance with environmental laws and regulations.
- Reputation: Our reputation may suffer in the public eye (customers, investors, other stakeholders, etc.) if we fail to address climate change or meet our climate-related targets. This can lead to a loss of trust, credibility, and financial buoyancy.
- Regulatory: Some policy measures or uncertainty regarding how or when to implement them could have a negative impact on production costs and potentially affect our market growth.
Sixteen transition risks and three opportunities were identified in these six risk clusters:
Overall transition risks rating
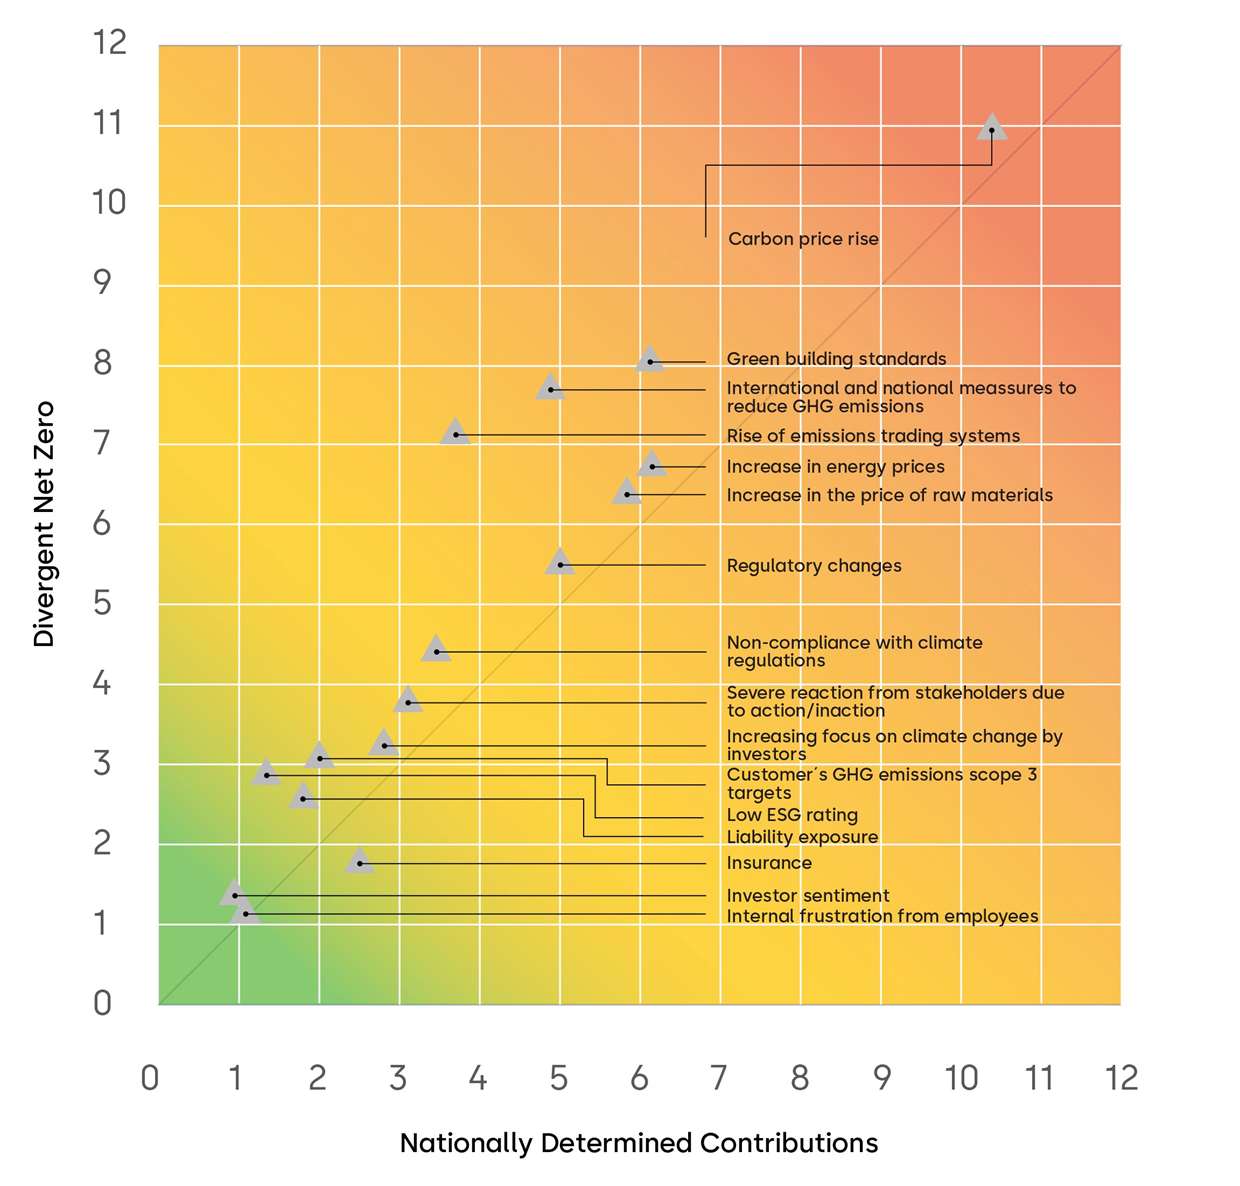
Long-term risks tend to have a higher significance and likelihood that they will occur. This is especially the case under the Divergent Net Zero scenario, where climate-related transition challenges are expected to be more severe. The exception is the “insurance” risk, which refers to disaster and catastrophe insurance premiums; they may be lower in a world where global warming has increased by only 1.5°C.
To calculate the overall risk ratings across various time horizons, we applied the following weightings: 50% for short-term risks (0–1 years), 30% for medium-term risks (1–3 years), and 20% for long-term risks (3–15 years). These weightings reflect a lower level of certainty when it comes to long-term projections.
Of the 16 risks identified, six come with a high impact and likelihood of occurrence in either or both climate scenarios. The most significant is rising carbon prices due to national and international carbon schemes. This, combined with the increasing cost of globally sourced goods, could lead both to higher operating costs and a fall in demand due to escalating product prices. This is especially important to consider when looking at future mergers and acquisitions and the procurement of machinery (due to their energy consumption).
By the end of 2030, the annual carbon costs for our own Scope 1+2 emissions could range from USD 12 to 89 million (this would be lower under the NDCs scenario and higher under the Divergent Net Zero scenario).
Another factor to consider is the unquestionable increase in the price of raw materials. For instance, European enterprises importing aluminum and steel from outside the EU will face higher costs due to the Carbon Border Adjustment Mechanism (CBAM) and associated Scope 3 emissions.
Most significant transition risks and impacts
|
Risk title |
|
Description |
|
Business element impact |
|
Financial impact |
|
Financial impact pathway |
|
Carbon price increase |
|
Higher price of carbon through national and international schemes |
|
Operations, markets |
|
Cost |
|
Higher operating costs, reduced demand due to rising product prices |
|
Rise of emissions trading systems |
|
Higher price of carbon or taxes if cap is exceeded |
|
Operations, markets |
|
Cost, capital investment |
|
Potential increase in cost of legal compliance |
|
International and national measures to reduce GHG emissions |
|
Regulation requiring significant equipment modifications, operational changes or the purchase of emissions credits to reduce GHG emissions from operations |
|
Operations, markets, legal and compliance |
|
Capital investment, preparations, cost |
|
Increased capital costs, higher compliance, operating and remediation costs |
|
Green building standards |
|
Changes to building codes and standards for more energy efficiency and sustainability could impact demand for dormakaba’s products, particularly those related to access control and security in green buildings |
|
Product, market |
|
Revenue, investment |
|
Failure to adapt to new standards could result in reputational and financial damage |
|
Increase in energy prices |
|
Energy prices impacted by price of oil, gas and renewable energies |
|
Markets |
|
Revenue, operating costs |
|
Higher operating costs, reduced demand due to rising product prices |
|
Increase in the price of raw materials |
|
More volatility in supply and demand as well as wider commodity prices resulting in higher prices for raw materials |
|
Markets |
|
Revenue, operating costs |
|
Higher operating costs, reduced demand due to rising product prices |
Most significant transition opportunities and impacts
|
Type |
|
Risk title |
|
Description |
|
Business element impacted |
|
Financial impact |
|
Financial impact pathway |
|
Potential leveraging method |
|
Market |
|
More demand for products aiding climate adaptation and resilience |
|
Heat pumps and other low-carbon technologies will likely be in higher demand |
|
Markets, sales |
|
Revenue |
|
Increased revenue from higher sales of new products |
|
Investment in product development and plans for stronger market growth |
|
Regulation |
|
Commitment to development of public policies to reduce GHG emissions and the transition to a low-carbon economy |
|
Improving regulatory certainty can help to guide investment decisions and drive growth in demand for energy-efficient products |
|
Legal and compliance, markets |
|
Revenue |
|
New regulations may increase demand for low-carbon technology |
|
Investment in product development to meet anticipated future demand |
|
Technology |
|
Reduction of GHG emissions through product enhancements |
|
Harnessing breakthrough technologies to enhance products and reduce company/downstream GHG emissions |
|
Product, assets, markets |
|
Capital, financing, revenue |
|
Capital investment in technology is required, increased revenue from higher sales, lower fines/taxes for high GHG emissions |
|
Evaluation of breakthrough technologies and product-specific LCA, target for % of innovation pipeline to undergo sustainability assessment |
Physical risks and impacts
We have adopted a data-driven approach to identify and analyze those physical climate-related risks likely to have the greatest impact on our global operations. We also used this approach to map how these risks may evolve under different trajectories according to the three emissions scenarios as mentioned above, known as Representative Concentration Pathways (RCPs).
We evaluated the following risk types based on Verisk Maplecroft’s risk indices: climate change exposure; coastal flooding hazard; cooling degree days; drought hazard; extra-tropical cyclone hazard; flood hazard; heat stress; heating degree days; sea level rise; severe storm hazard; tropical storm and cyclone hazard; and water stress and wildfire hazard.
We conduct an annual high-level climate risk assessment of all sites across our operational regions and follow this up with a comprehensive assessment of our most important locations. These locations were designated as “material sites”, with the categorization being awarded based on factors such as net sales, number of employees, and tangible asset value based on a relative ranking of all other locations.
Based on these results, we have developed site-specific scorecards and benchmarks for each site, geography, and business entity. In FY 25/26, these were shared with the respective local management teams, along with recommended mitigation measures tailored to each risk type. As part of these discussions, local teams were tasked with quantifying the anticipated financial effects on asset value and net revenue as per ESRS E1-11. In the upcoming financial year, additional hazard types such as extreme low/high temperature, extreme precipitation, chronic change in precipitation, etc. will be considered and a clearer differentiation on short-, medium- and long-term time horizons aligned to ESRS will be implemented.
Material sites at extreme or high risk are considered high-priority sites for climate adaptation. These sites will be tasked with defining and implementing climate adaptation actions by FY 27/28, while other sites are given additional time to develop and implement their adaptation plans.
While some hazards have a low risk of exposure for dormakaba, such as coastal flood and landslide, others, such as severe storm, heating degree days, heat stress, drought and water stress, have a higher risk across multiple locations. The table below shows the types of climate risks applying to our material sites:
Most significant physical risks
|
Climate risk |
|
Description |
|
Business element |
|
Financial impact |
|
Financial impact pathway |
|
Cooling degree days |
|
Processes affected by high temperatures lead to reduced productivity or trigger emergency responses, or else affect staff working conditions |
|
Operations, Logistics, Sales, Assets, Finance |
|
Capital expenditure, operating costs, revenue |
|
Higher capital costs for adaptation measures, damage repairs/need for replacement equipment or materials, higher operating costs, reduced production |
|
Heating degree days |
|
Processes affected by low temperatures lead to reduced productivity or trigger emergency responses, or else affect staff working conditions |
|
Operations, Logistics, Assets, Sales, Finance |
|
Capital expenditure, operating costs, revenue |
|
Higher capital costs for adaptation measures, damage repairs/need for replacement equipment or materials, higher operating costs, reduced production |
|
Severe storm |
|
Severe storms impact operations and infrastructure, including: damage to buildings; supply chain disruption due to impact on transportation of materials; impact on employee homes and ability to commute to work; disruption to energy and water supply |
|
Operations, Logistics, Sales, Assets, Finance |
|
Capital expenditure, operating costs, revenue |
|
Higher capital costs for adaptation measures, damage repairs/need for replacement equipment or materials, higher operating costs, reduced production |
|
Drought |
|
Reduced access to water impacts productivity |
|
Operations, Sales, Assets |
|
Operating costs, revenue |
|
Higher costs due to lack of access to water, reduced revenue from lower sales |
|
Heatwaves/heat stress |
|
Processes affected by high temperatures lead to reduced productivity or trigger emergency responses, or else affect staff working conditions |
|
Operations, Logistics, Sales, Assets, Finance |
|
Capital expenditure, operating costs, revenue |
|
Higher capital costs for adaptation measures, damage repairs/need for replacement equipment or materials, higher operating costs, reduced production |
|
Water stress |
|
Reduced access to water affects productivity |
|
Operations, Sales, Assets |
|
Operating costs, revenue |
|
Higher costs due to lack of access to water, reduced revenue from lower sales |
|
Extreme rainfall |
|
Heavy rainfall causes water to collect on stock tank roofs, which may cause the roof to sink and compromise the tanks’ containment ability, leading to reduced productivity, essential emergency responses, and rising river water levels, which may damage facilities or cause transportation disruption |
|
Operations, Sales, Assets, Finance |
|
Capital expenditure, operating costs, revenue |
|
Higher capital costs for adaptation measures, damage repairs/need for replacement equipment or materials, higher operating costs, reduced production |
Geographical exposure to physical risks
|
Risk type |
|
Climate hazard |
|
Countries potentially impacted |
|
Acute |
|
Drought hazard |
|
Spain, Bulgaria |
|
|
Severe storm |
|
Australia, China, India, Singapore, Malaysia, USA, Italy, Taiwan |
|
|
|
Tropical storm and cyclone hazard |
|
China, Taiwan |
|
|
|
Wildfire hazard |
|
USA |
|
|
Chronic |
|
Cooling degree days |
|
Australia, China, Spain, India, Singapore, Canada, Malaysia, USA, China, Taiwan |
|
|
Heat stress |
|
China, India, Singapore, Malaysia, USA, India, Taiwan, |
|
|
|
Heating degree days |
|
Switzerland, Germany, Spain, France, Netherlands, Poland, Russia, Bulgaria, Canada, China, Italy, USA |
|
|
|
Water stress |
|
China, Germany, Spain, India, Russia, Singapore, USA |
Resilience of our company strategy
The overall conclusion of these analyses is that there are no indications of any risks that could significantly threaten dormakaba’s overall business continuity in the short, medium or long term. We remain committed to mitigating the risks identified, as this will allow us to safeguard our operations and maintain our competitive edge.
This includes:
- Increasing our investment in low-carbon technologies and in the course of capital allocation decisions through our climate transition plan.
- Developing quantification methodologies to gauge the potential financial implications of transition risks beyond carbon prices.
- Continuing to refine methodologies on the potential financial implications associated with the identified physical risks, along with the costs involved in implementing the mitigation measures.
- Continuing to evaluate the carbon emissions of potential acquisitions and apply carbon pricing into mergers and acquisitions decisions.
- Continuing to evaluate and promote the diversification of energy sources and sources of supply for key commodities.
- Continuing to develop more energy-efficient products to leverage green building market opportunities.
We also conducted a transition risk analysis, this time using two climate change scenarios as our basis. The analysis factored in three dimensions: likelihood, significance, and time frame (see previous sections).
Internal carbon pricing
To mitigate our highest-priority transition risk — increasing carbon prices — we apply shadow carbon pricing to all non-IT fixed asset investment decisions and M&A due diligence processes. A dynamic carbon price, ranging from CHF 43 to CHF 99 per tCO2 depending on the year, is integrated into cashflow, EBITDA, and internal rate of return calculations. The average carbon price projections are calculated along the Nationally Determined Contributions (NDCs) scenario based on an unweighted average across all dormakaba’s countries of operation, and an 8% discount rate is applied based on the Weighted Average Cost of Capital (WACC) listed in our financial filings.
The investment application provides the user with transparency on the total cost of energy (electricity and/or heating fuels) and total cost of carbon for the entire lifetime of the machinery up until 2045. This ensures that both environmental and financial considerations are central to our investment strategies, supporting our commitment to sustainable growth.
Our climate transition plan
We are opening the doors wide to a low-carbon economy. We aim to be net zero by 2050 at the latest. Let’s look closer at our near-term Scope 1+2 targets.
Absolute emissions targets: Scope 1+2
As approved by the Science Based Targets initiative (SBTi), our target is to reduce absolute Scope 1+2 greenhouse gas (GHG) emissions by at least 42% by 2030, in line with a 1.5°C future, without the use of carbon offsets (baseline 74,770 tCO2e in FY 19/20*). This means total emissions savings of 31,403 tCO2e versus the baseline. Any residual emissions will then be voluntarily compensated through Gold Standard offsets to achieve our target of becoming carbon neutral by 2030. In line with our science-based emission reduction targets, we aim to reduce the energy intensity of our operations by 25% by 2030 (baseline 100.5 MWh/mCHF in FY 19/20).
Our strategy
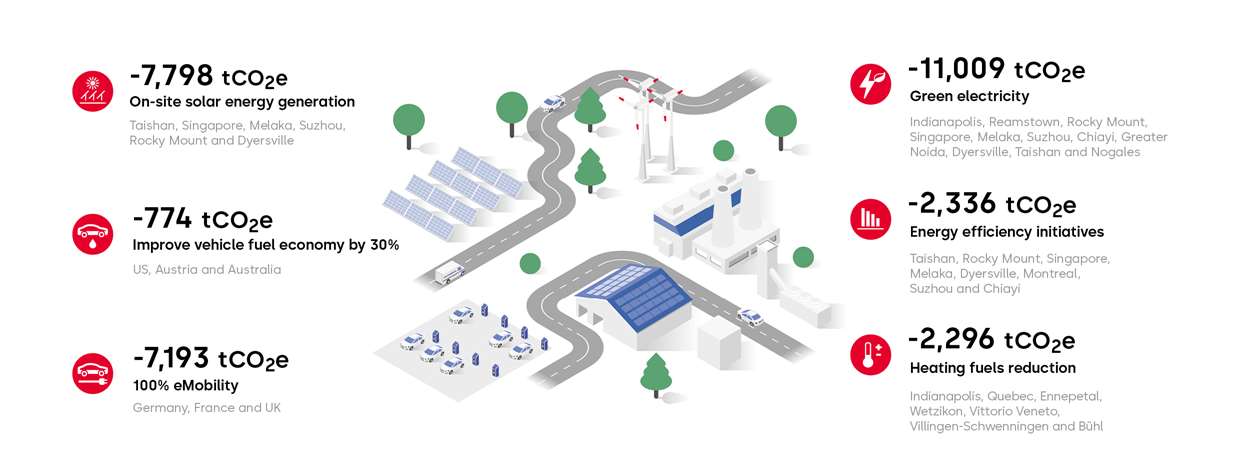
To achieve the 42% reduction (31,403 tCO2e) of Scope 1 and 2 emissions, we have set must-have initiatives along six levers, which must be completed by 2030. These initiatives are executed at dormakaba sites, where we can have the largest impact on reducing our CO2 emissions. The climate transition plan was approved by the Executive Committee and Board of Directors as part of our Sustainability Framework and target-setting approval process described here. We are on track with our Scope 1 and 2 climate action plan and have already achieved a 26% reduction since the baseline in FY 19/20.
Our levers and contributing locations
Absolute emissions targets: Scope 3 Category 1 and 11
We have also set a target to reduce our value chain emissions (Scope 3) from purchased goods and services, and the use of sold products by 25% by 2030 (baseline 734,850 tCO2e in FY 19/20*).
Scope 3 emissions constitute around 90% of our combined Scope 1, 2, and 3 carbon emissions, highlighting the importance of Scope 3 emissions for our climate strategy. While setting our baselines, we carried out screening across all relevant Scope 3 emissions categories, which showed that the largest sources of Scope 3 emissions are Category 1: Purchased goods and services and Category 11: Use of sold products. This is why we have set our SBTi targets based on these two categories.
We do not yet have a granular climate transition plan for Scope 3 Category 1, primarily because emissions data is reported on spend or on a material type basis, rather than disaggregated to an individual supplier level. This means we have little leverage to encourage suppliers to decarbonize. To address this, in FY 25/26 we started to collect primary CO2 data from our most carbon-intensive suppliers. In the meantime, we are working closely with metal suppliers to evaluate if they can deliver low-carbon goods with higher recycled content to build a preferred supplier database and evaluate potential switches. We plan to have the Scope 3 transition plan ready in FY 26/27.
* Base year determined based on SBTi submission
Innovation for a low-carbon economy
When it comes to primary energy consumption, the building sector is one of the world’s largest energy consumers, making its impact on climate change significant. As part of our Scope 3 Category 11 strategy, our new products have best-in-class energy efficiency. A key enabler has been our digital Product CO2 Inventory Tool, which provides information on the carbon emissions of around 350 energy-consuming products during their use phase (the calculation method is in line with the GHG Protocol), including those that are battery-operated or connected to the electricity grid. This facilitates product development and optimization activities to create more energy-efficient products and also contributes to our target of decreasing Scope 3 emissions from the use phase of sold products.
We continue to include the top ten carbon-intensive products identified by the tool in our sustainability initiatives tracker, tasking product development teams with evaluating and implementing energy efficiency strategies for them.
We also offer sustainable solutions to help address Scope 4 (avoided) emissions, such as Motion IQ and the Door Efficiency Calculator. MotionIQ is an intelligent sensor system which ensures that automatic doors only open when they really need to and for no longer than necessary. This means the doors move less frequently, thus reducing air exchange and the energy needed for heating or cooling. Using the MotionIQ system together with swing door operators typically saves 50% of energy versus without. Additionally, the service life of the drive technology is extended, as unnecessary openings are avoided.
The Door Efficiency Calculator helps customers compare and analyze different automatic doors in terms of their impact on a building’s airflow, energy use, and CO2 emissions, depending on factors such as building type, usage, and typical weather conditions for the site. This enables more informed decisions and supports the selection of the most energy-efficient entrance solution for each building.
Our performance
Scope 1 and 2 emissions
Greenhouse gas emissions by source (tCO2e)
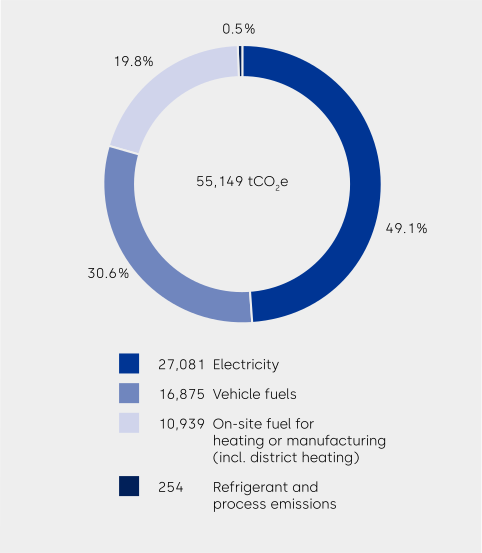
Scope 1 and Scope 2 greenhouse gas emissions (tCO2e)1
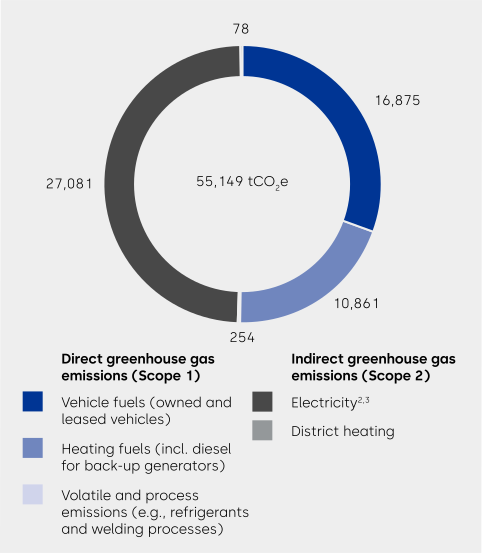
In FY 25/26, our total greenhouse gas (GHG) emissions (Scope 1+2) amounted to around 55,000 tCO2e. Nearly half of these emissions are attributed to electricity consumption, followed by vehicle fuel use. Key decarbonization projects and initiatives launched during the year are expected to avoid approximately 2,300 tCO2e. Among these, energy efficiency and heating fuels reduction measures will deliver annual energy savings of 3,331 MWh. Overall energy consumption increased by 1.3% to 247,618 MWh, and energy intensity remained relatively stable at 88.7 MWh/mCHF net sales vs. 85.1 MWh/mCHF in the previous year.
Key decarbonization activities
|
Lever |
|
Location |
|
Initiative |
|
OpEx investment in FY 25/26 (CHF thousand) |
|
CapEx investment in FY 25/26 (CHF thousand) |
|
Expected energy savings (MWh/year) |
|
Expected CO 2 savings (tCO 2 e/year) |
|
|
On-site solar generation |
|
Dyerville (USA) |
|
Photovoltaic solar installation |
|
0 |
|
0 |
|
N/A |
|
367 |
|
|
|
Nogales (Mexico) |
|
Photovoltaic solar installation |
|
0 |
|
0 |
|
N/A |
|
548 |
|
|
|
Vehicle fuels reduction |
|
Dyerville (USA) |
|
Electric forklifts |
|
0 |
|
125 |
|
36 |
|
5 |
|
|
|
Hallam (Australia) |
|
Switch to hybrids and more efficient vehicles |
|
0 |
|
737 |
|
369 |
|
92 |
|
|
|
Heating fuels reduction |
|
Quebec (Canada) |
|
Electrical heaters |
|
0 |
|
92 |
|
0 |
|
277 |
|
|
|
Dyerville (USA) |
|
Air make up unit replacement |
|
0 |
|
77 |
|
262 |
|
54 |
|
|
|
|
Wetzikon (Switzerland) |
|
Heat pump |
|
0 |
|
20 |
|
568 |
|
123 |
|
|
|
|
|
Electroplating process optimization |
|
0 |
|
2,337 |
|
26 |
|
19 |
|||
|
|
Vittorio Veneto (Italy) |
|
Setpoint temp management |
|
0 |
|
0 |
|
475 |
|
88 |
||
|
Energy efficiency |
|
Singapore |
|
Chiller replacement |
|
0 |
|
1,316 |
|
453 |
|
184 |
|
|
|
|
Electric resistance optimization |
|
0 |
|
90 |
|
313 |
|
140 |
|
||
|
|
|
Cooling panel replacements |
|
0 |
|
147 |
|
22 |
|
9 |
|
||
|
Air handling unit optimization |
0 |
|
0 |
|
98 |
|
40 |
|
|||||
|
Air compressor replacement |
0 |
|
135 |
|
158 |
|
66 |
|
|||||
|
|
Bühl (Germany) |
|
Laser cutting machine |
|
0 |
|
242 |
|
150 |
|
0 |
|
|
|
Ennepetal (Germany) |
Turning/milling machine replacement |
0 |
|
501 |
|
37 |
|
0 |
|
||||
|
Senai (Malaysia) |
Laser machine replacement |
0 |
|
99 |
|
5 |
|
3 |
|
||||
|
|
Taishan City (China) |
|
Polishing line optimization |
|
0 |
|
123 |
|
22 |
|
14 |
|
|
|
Motor replacements |
0 |
|
34 |
|
41 |
|
24 |
|
|||||
|
Air compressor replacement |
0 |
|
0 |
|
240 |
|
142 |
|
|||||
|
Energy‑efficient upgrade of pneumatic press machines |
0 |
|
147 |
|
59 |
|
35 |
|
|||||
|
Variable speed drive installations |
0 |
|
9 |
|
79 |
|
58 |
|
|||||
|
Greater Noida (India) |
Air compressor replacement |
0 |
|
87 |
|
33 |
|
0 |
|
||||
|
Vittorio Veneto (Italy) |
Installation of electric filter |
0 |
|
51 |
|
41 |
|
0 |
|
Scope 3 emissions: Category 1 and 11
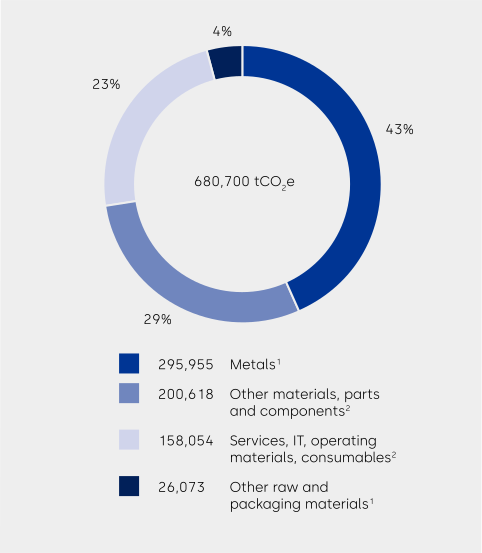
Scope 3 emissions: purchased goods and services (tCO2e)1, 2
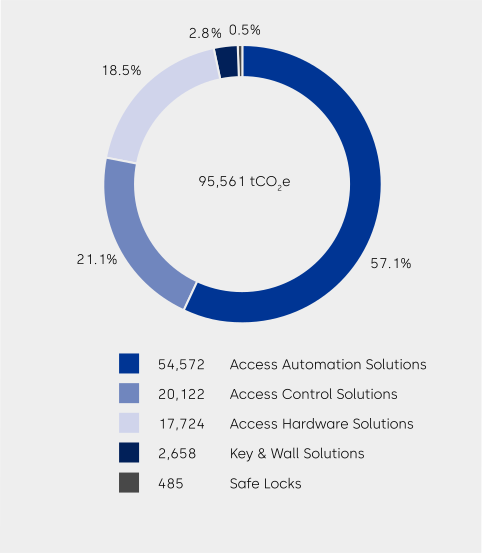
Scope 3 emissions: use phase of products (tCO2e)3
Achieved GHG reductions
|
|
|
Retrospective |
|
Milestones and targets |
||||||||||||
|
|
|
FY 19/20 |
|
FY 24/25 |
|
FY 25/26 |
|
FY 25/26 vs. FY 24/25 (%) |
|
FY 26/27 |
|
FY 29/30 |
|
FY 49/50 |
|
Annual % target / Base year |
|
Scope 1 + 2 GHG emissions (tCO 2 e) 1 |
|
74,770 |
|
55,929 |
|
55,149 |
|
–1.4% |
|
52,786 |
|
43,366 |
|
7,477 |
|
4.2% |
|
Scope 1 GHG emissions |
|
31,162 |
|
27,199 |
|
27,991 |
|
2.9% |
|
21,999 |
|
18,073 |
|
3,116 |
|
4.2% |
|
Scope 2 GHG emissions |
|
43,608 |
|
28,730 |
|
27,158 |
|
–5.5% |
|
30,787 |
|
25,293 |
|
4,361 |
|
4.2% |
|
|
|
|
|
|
|
|
|
|
|
|
|
|
|
|
|
|
|
Significant Scope 3 GHG emissions (tCO 2 e) |
|
734,850 |
|
785,778 |
|
776,261 |
|
–1.2% |
|
626,919 |
|
551,138 |
|
73,485 |
|
2.5% |
|
Category 1: Purchased goods and services |
|
567,250 |
|
679,368 |
|
680,700 |
|
0.2% |
|
483,935 |
|
425,438 |
|
56,725 |
|
2.5% |
|
Category 11: Use of sold products |
|
167,600 |
|
106,410 |
|
95,561 |
|
–10.2% |
|
142,984 |
|
125,700 |
|
16,760 |
|
2.5% |
|
Total GHG emissions in scope of our SBTi targets |
|
809,620 |
|
841,707 |
|
831,410 |
|
–1.2% |
|
681,448 |
|
594,504 |
|
80,962 |
|
|
1 All data in the table is in tCO 2 e. Scope 2 is market-based
In alignment with our decarbonization strategy, GHG removals and/or financed GHG mitigation projects through carbon credits have not been utilized during this reporting period.
EU Taxonomy
The EU taxonomy provides financial and non-financial companies with a common definition of economic activities considered environmentally sustainable. It recognizes that directing capital flows towards more sustainable activities requires a shared, holistic understanding of the environmental impacts of economic activities and investments.
Under the EU taxonomy technical screening criteria, a company’s internal economic activities can be classified by environmental sustainability across six objectives:
- Climate change mitigation
- Climate change adaptation
- Transition to a circular economy
- Pollution prevention and control
- Protection and restoration of biodiversity and ecosystems
- Sustainable use and protection of water and marine resources
Economic activities that may contribute to one of the environmental objectives are considered taxonomy-eligible. Taxonomy-eligible activities that meet the sustainability criteria are taxonomy-aligned. Alignment requires meeting three sets of criteria:
- Substantial contribution to one of the six environmental objectives
- No significant harm regarding the other five environmental objectives (Do No Significant Harm, DNSH)
- Compliance with minimum social and governance requirements (minimum safeguards)
Articles 3 and 9 of Taxonomy Regulation (EU) 2020/852 (Taxonomy) require dormakaba to disclose sales, capital expenditure (CapEx), and operating expenditure (OpEx) related to environmentally sustainable economic activities.
Following a detailed review of Technical Annex 1 of the Taxonomy Regulation (EU) 2020/852 and Commission Delegated Regulation (EU) 2023/2486, we found that only a limited number of our revenue-generating activities are taxonomy-eligible. This review covered the full scope of our products and solutions and was conducted together with Product Sustainability and Product Management. The EU taxonomy classification is largely not applicable to most of our revenue-generating activities, nor to the access solutions industry in general. Eligibility is more relevant in the area of the circular economy. No eligibility was identified for pollution prevention and control, protection and restoration of biodiversity and ecosystems, or sustainable use and protection of water and marine resources. We will continue to reassess this regularly.
The company’s eligible revenue-generating activities are listed in the table below.
|
Objective |
|
Economic activity |
|
Taxonomy-eligible activities |
|
Climate change adaptation and mitigation |
|
3.5. Manufacture of energy efficiency equipment for buildings |
|
Manufacture of doors that could be installed as external doors with U-value lower than or equal to 1.2 W/m 2 K* |
|
Substantial contribution to the transition to a circular economy |
|
1.2. Manufacture of electrical and electronic equipment |
|
All new electrical products include the circularity approach |
|
|
|
4.1. Provision of IT/OT data-driven solutions |
|
We develop, install, deploy, maintain, repair, and provide professional services related to operational technologies for some of our products. |
|
|
|
5.2. Sale of spare parts |
|
We sell spare parts to maintain the functionality of the product. |
* Taxonomy Report 2020/852 Technical Annex 1, section 3.5. Manufacture of energy efficiency equipment for buildings; relating to “doors with U-value lower or equal to 1.2 W/m 2 K”. Revenues from all doors that could be installed as external doors were therefore defined as eligible. Product management then reported the U-values for all such doors to determine taxonomy alignment.
Cross-cutting activities to which only capital and operating expenditures are attributed were also considered, such as solar PV projects, electric vehicle charging installations, and energy efficiency initiatives. Eligible activities can be found below.
|
Objective |
|
Economic activity |
|
Taxonomy-eligible activities |
|
Climate change adaptation and mitigation |
|
7.3 Installation, maintenance, and repair of energy efficiency equipment |
|
Installation of new air compressors or other energy-consuming equipment |
A summary of the results for FY 25/26 can be found below. The investment and spend values related to CapEx and OpEx were taken into account only for those initiatives that are eligible and/or aligned and that are tracked and controlled in our global Sustainability Initiatives tracker tool to prevent double counting. A due diligence assessment against the minimum safeguards and DNSH criteria was undertaken by our Human Rights function. The detailed breakdown by environmental objective related to turnover and CapEx can be found in the Indices section of this report.
|
|
|
Taxonomy-aligned |
|
Taxonomy-eligible but not aligned |
|
Taxonomy-eligible |
|
Taxonomy non-eligible |
|
Turnover 1 |
|
0.2% |
|
28.9% |
|
29.1% |
|
70.9% |
|
CapEx 2 |
|
4.4% |
|
0.0% |
|
4.4% |
|
95.6% |
1 Turnover (eligible): Net sales from external doors, software, spare parts, electronic products. For the latter three, alignment was not assessed and therefore categorized as not aligned. Turnover (aligned): Net sales from doors with a thermal efficiency U-value of less than or equal to 1.2 W/m 2 K
2 CapEx includes: CapEx for energy efficiency initiatives