Environmental Management
16 mindormakaba seeks to reduce the environmental impact of production and to adhere to environmental laws and regulations.
Why it matters
Every business, government and individual has a role to play in meeting the goals of the Paris Agreement. For our part, dormakaba aims to reduce our energy consumption and related emissions. We use the latest scientific knowledge to guide a sound management approach. Our energy-intensive processes include melting, and aluminum and zinc die casting. We use these materials to manufacture numerous products including hotel and high-security locks, door closers, fittings and door handles.
Find out how we are moving from an energy consumer to an energy producer in this interview with William Lee, our Senior Manager Operations, dormakaba Movable Walls APAC.
Read interviewKey activities
dormakaba seeks to reduce the environmental impact of production and to adhere to environmental laws and regulations. We focus on improving our management of environmentally related processes and on monitoring and reducing our energy consumption, carbon emissions, water consumption and effluents, as well as monitoring our waste disposal and recycling rates.
Environmental management is embedded at both the Group and local levels of our various production locations. Several locations have environmental officers, while others have incorporated environmental management into their quality assurance processes.
Our environmental management covers the following aspects:
- Energy and emissions
- Water and effluents
- Waste
Energy and emissions
The emission of greenhouse gases, which are generated through the use of fossil fuels, is one of today’s biggest challenges. dormakaba has signed a commitment letter to the Science Based Targets initiative to set a science-based, Group-wide carbon emissions reduction target by September 2020.
The company has signed a commitment letter to the Science Based Targets initiative (SBTi) to set a science-based, Group-wide carbon emissions reduction target, and we have worked since the financial year 2017/18 to meet their target submission requirements. This included carrying out a screening and carbon inventory development of Scope 3 emissions, as well as expanding the coverage of our Scope 1 and Scope 2 emissions to an additional 31 sites, with total Scope 1 and 2 emissions representing over 92% of employees. It was agreed with the SBTi that our Scope 1, 2 and 3 reduction targets will be validated in the course of the financial year 2020/21. dormakaba continues to be committed to long-term carbon emissions reductions, as evidenced by our support of the UN-backed, CEO-led climate advocacy effort in May 2020 urging governments around the world to align their Covid-19 economic aid and recovery efforts with the latest climate science.
As a further commitment, we have set an interim carbon emissions reduction target of –5% tonnes of carbon dioxide equivalent (tCO2e) by the end of the financial year 2020/21 for the reporting scope and baseline of the financial year 2017/18. The company has reduced over 15% so far, with approximately 9 percentage points stemming from increased purchase of renewable energy and energy efficiency projects. Other reductions in emissions are explained by decreased production due to the business impact of Covid-19 (as detailed in the Annual Report 2019/20), consolidation of production facilities in the USA, improvements in data quality and changes in seasonal weather patterns.
Energy consumption
Total energy consumption was over 245,000 MWh in the financial year 2019/20. Electricity and fuels for heating or manufacturing both play a crucial role in our production processes, constituting nearly 79% of total energy consumption. The remainder is associated with the fuel consumption of our vehicle fleet.
Many components used to create our products are manufactured in-house, and purchased parts require further processing, both of which impact total energy demand. As a result, we focus many of our energy saving initiatives in this area.
In the financial year 2019/20, energy saving initiatives were being implemented at various sites in the reporting coverage. This work included retrofitting facilities to LED lighting systems; upgrading equipment such as air compressors, as well as milling and key biting machines; the optimization of heating and cooling systems (installation of air curtains, heat recovery, renewal of circulation pumps, radiators and valves); and the procurement as well as on-site production of renewable electricity.
As a result, we realized total quantifiable annual energy savings of approximately 4,300 MWh for the sites covered in the scope of this report. In addition, over 46,000 MWh (37%) of the electricity that dormakaba consumed came from renewable sources. In our Access Solutions (AS) EMEA segment, this share already reached over 64%. All other segments showed a percentage of electricity consumption from renewable resources ranging from 32–39%.
Besides the examples highlighted in the Good Practices map, further energy reduction activities in the financial year 2019/20 included:
- The AS AMER manufacturing facility in Phoenix (USA), which uses water chillers for the resistance welding equipment in a closed-loop system, installed new chillers that are 50% more efficient.
- AS APAC identified leaks of the air pipes below ground of the manufacturing facility in Taishan (China). Replacing the pipes resulted in energy savings of 756,000 kWh/a for the air compressors. Further, the facility eliminated the use of kerosene as a heating fuel in the die casting processes by installing electrically powered machinery instead.
- In Australia, the fleet management team has developed a strategy to procure more environmentally friendly vehicles for management, sales and service teams. They have already begun switching around 100 vehicles to hybrid models, with expected fuel cost savings of 27% and carbon emissions reductions of 33% compared to the outgoing models once the project is complete in 2023.
- AS EMEA refurbished its heating system at the Villingen-Schwenningen (Germany) manufacturing facility with a new ventilation system including a combined heat and power plant to reduce energy consumption. The heat recovery is 75%, the equivalent of a reduction of 400 tCO2e on an annual basis.
- For the Key & Wall Solutions segment, the Key Systems business unit’s facility in Rocky Mount (USA) replaced its extrusion press oven with a new efficient oven, resulting in a reduction of natural gas use by the equivalent of 194 tCO2e on an annual basis.
in MWh |
| 2019/20 |
Energy consumption |
| 245,042 |
Electricity |
| 125,327 |
District heating |
| 1,489 |
Heating fuels total |
| 66,694 |
Heating oil, kerosene and diesel for backup generators |
| 7,128 |
Natural gas |
| 58,179 |
LPG/propane |
| 1,388 |
Vehicle fuels total |
| 51,531 |
Diesel |
| 39,668 |
Gasoline |
| 10,505 |
LPG/propane |
| 1,280 |
Other vehicle fuels |
| 79 |
Energy use
(in MWh)

Purchased electricity by source
(in %)

Energy use by segment (in MWh)

Purchased electricity by segment (in MWh) *

Percentage of purchased electricity from renewable sources by segment (in %) *

Greenhouse gas emissions
In the financial year 2019/20, our total greenhouse gas emissions (GHG) amounted to nearly 73,000 tCO2e. Around 60% were emitted as a consequence of electricity consumption, followed by heating and vehicle fuel consumption, and volatile as well as process gas emissions. Climate-related initiatives implemented during the reporting year resulted in total annual savings of approximately 16,400 tCO2e (over 20% of our total footprint).
Due to the implementation of energy saving initiatives outlined above, we expect to reduce our annual GHG emissions by approximately 2,300 tCO2e. We also worked diligently to source renewable electricity or generate own renewable energy wherever feasible, leading to an annual emissions avoidance of approximately 14,100 tCO2e.
Examples of GHG reduction activities in the financial year 2019/20 included:
- Our AS AMER facility in Indianapolis (USA) switched to green electricity in early 2020, saving approximately 4,600 tCO2e per year. This switch is expected to reduce 6% of our global carbon footprint, greatly contributing to the achievement of our emissions reduction target of –5% tCO2e by the end of the financial year 2020/21.
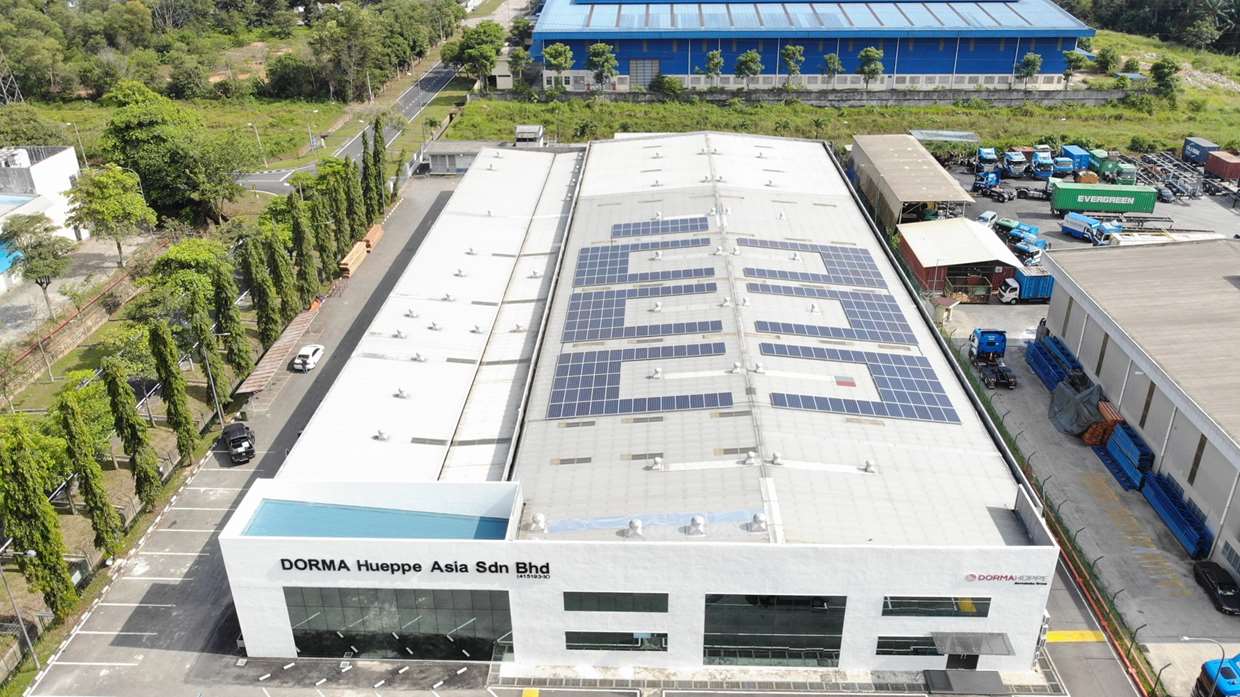
- Our Key Systems facility based in Senai (Malaysia) has installed a solar power plant on its roof, reducing carbon emissions by about 40% and with an expected return on investment in 3.5 years.
Greenhouse gas emissions by source (in tCO2e)

Scope 1 and Scope 2 emissions
(in tCO2e)1

- Greenhouse gas inventory calculated in accordance with the WRI/WBCSD Greenhouse Gas Protocol. Emission factor sources: UK Defra (2019), US EPA eGRID (2018), IEA (2019), AIB (2018).
- Scope 1: direct greenhouse gas emissions from sources owned or controlled by dormakaba.
- Scope 2: indirect greenhouse gas emissions from sources owned or controlled by another entity, as a consequence of the company’s activities.
- The greenhouse gas emissions associated with electricity consumption are reported according to the “market-based approach”, as defined in the Greenhouse Gas Protocol Scope 2 Guidance. When reported according to the “location-based approach”, the emissions totaled 60,370 tCO2e.
Greenhouse gas emissions by segment (in tCO2e)

As part of our commitment to the Science Based Targets initiative, we carried out a screening and carbon inventory development of Scope 3 emissions. The screening showed that the largest sources of Scope 3 emissions stem from purchased goods and services (75%) and use phase of sold products (11%). We also learned that Scope 3 emissions constituted around 90% of our combined Scope 1, 2 and 3 carbon emissions, highlighting the importance of Scope 3 emissions on our climate strategy. In a second phase, we therefore developed carbon inventories for these categories of purchased goods and services and of use phase of products. For the latter, we calculated the footprint of the 334 products that consume energy after installation, including those that are battery-operated. Due to the impacts of Covid-19, the sales and purchase volumes from the financial year 2018/19 were used in the calculations.
Scope 3 emissions: Purchased goods and services (in tCO2e)1,2

Scope 3 emissions: Use phase of products (in tCO2e)3

- Calculated via direct material weight. Emission factor sources: UK Defra (2019), US EPA eGRID (2018), IEA (2019), AIB (2018).
- Calculated via spend volume.
- Calculated via energy consumption during the use phase. Emission factor sources: UK Defra (2019), US EPA eGRID (2018), IEA (2019), AIB (2018).
Water and effluents
In the financial year 2019/20, dormakaba reassessed the water stress levels for all our sites, including those beyond the regular scope of this report. The new analysis revealed that approximately 40% of sites have the potential for high to extreme water stress, defined as a “water demand to supply ratio of 40% or greater for the respective municipality”. The data stems from a geographical analysis of water stress at catchment level for the year 2020 for dormakaba sites. The water stress analysis is based on the two databases Aqueduct Water Risk Atlas by the World Resources Institute and AQUASTAT by the Food and Agriculture Organization. Results of the updated risk assessment will be shared with those sites having (1.) high or extreme water stress, and (2.) high water consumption relative to other sites for development of mitigation plans.
Water stress level by sites*

The majority of our total water consumption is municipal water used for cooling, manufacturing processes, and for sanitation purposes. Wastewater is mainly discharged via the local municipal sewerage system, in compliance with local requirements and treated by third-party companies where necessary.
Besides those shown in the Good Practice map, examples of water savings activities and good practice in effluents management in the financial year 2019/20 included:
- AS APAC identified and replaced rusted underground water pipes in the manufacturing facility in Taishan (China) saving 3,500 m3 of water per year. The subsidiary in Taiwan installed processes to reuse 1,220 m3 of grey water, and the manufacturing facility in Chennai (India) installed drip irrigation to water their gardens, reducing around 10% of overall water consumption.
- AS DACH installed a coolant emulsion recovery system to reuse the separated water and distilled emulsion at the manufacturing facility in Suzhou (China) and implemented a daily water usage monitoring system to quickly detect leaks or changes in consumption pattern at the manufacturing facility in Melaka (Malaysia).
- Key & Wall Solutions made improvements to its wastewater treatment system in Rocky Mount (USA), reducing water use and risk of polluting the local water supply through the effluent. This included replacing an aging copper analyzer with a new, multi-metal analyzer for copper and nickel. The analyzer will be to detect metal levels at the final stage of treatment and redirect the effluent to a holding tank for further processing if levels are too high, before the effluent is transferred to the municipal water treatment plant. The EHS team also installed a new pH meter that allows for adjusting the pH levels to pull the nickel out of the effluent more easily and swapped to a more environmentally friendly soap for cleaning the burnisher, among other improvements.
Water consumption

Wastewater discharge

Waste
Next to water consumption and effluents, waste management is of key importance during the electroplating, surface finishing and painting processes. Our filter systems ensure that potentially hazardous substances are not released externally.
Toxic waste arising from painting and electroplating is disposed of as special waste. In addition, scraps from turning and milling or punching are recycled, and returned, for example, to the suppliers of the raw materials. Certified disposal companies are commissioned to dispose of industrial waste and chemicals, and to recycle materials.
The generation of different waste streams is an inevitable consequence of our operations. We monitor our waste by treatment method and by waste type. Approximately 68% of the waste stream was recycled, reused or recovered (including raw materials and energy recovery) in financial year 2019/20. At about 76% by weight, the largest proportion of waste is scrap metal.
Besides the examples shown in the Good Practice map, examples of waste activities in financial year 2019/20 included:
- AS AMER rolled out a program to replace oil mats with new absorbent, reusable ones for the shop floor, which were used to recover the oil and avoid 5000 lbs. of oil waste for the Indianapolis (USA) facility. The oil is now captured and recycled.
- AS APAC’s manufacturing facility in Taishan (China) completed the installation of treatment system to filter out water from electroplating sludge, which is estimated to reduce sludge waste disposal from electroplating by 40% (around 300 tons per year).
- AS DACH’s manufacturing facility in Suzhou (China) invested in a recovery system for separating paint thinner from paint mixes. The recovered paint thinner is reused to clean the paint system pipes and equipment.
- In AS EMEA, new customers of dormakaba locking systems in Switzerland were traditionally sent a security ID card and information brochure for registration and reordering additional or replacement keys. Over 60,000 plastic security cards and brochures were distributed every year. To reduce paper and plastic waste, a new system was developed for sending one sheet of FSC-certified paper, with printed security cards and a QR code directing customers to digital information brochures. This action will save 3 tons of paper and 300 kg of plastic per year.
Non-hazardous waste by type
(in metric tons)

Waste by treatment path

Hazardous waste
by type (in metric tons)

Our performance
To ensure our environmental management is state-of-the-art, we refer to international standards for environmental management (ISO 14001) and energy management (ISO 50001). All manufacturing sites that have more than 100 employees, and non-negligible hazardous materials in use, are expected to maintain an environmental management system based on ISO 14001. Those with production process that could potentially seriously harm the environment are required to certify their environmental management system. These processes include plating, anodizing, polishing, galvanizing, painting and casting.
Today, 36% of the manufacturing sites based on our reporting scope in 2017/18 already benefit from environmental standards set forth by ISO 14001 (or similar) certification. We aim to increase this total to over 50% by the end of the financial year 2020/21 (baseline financial year 2017/18).
In the financial year 2019/20, our manufacturing facilities in Senai (Malaysia), Westerstede (Germany) and in Taiwan, for example, became ISO 14001 certified and handle environmental issues according to the international standard.
Further, all manufacturing sites are expected to maintain an energy management system based on ISO 50001 by the end of the financial year 2021/22. Currently 21% of manufacturing sites do so. In order to raise awareness and clarify expectations, a checklist on Group standards for energy management systems was developed and shared with all manufacturing sites in the financial year 2019/20.
Segment |
| ISO 14001 Certificate |
| Maintain Environmental Management System |
| ISO 50001 Certificate |
| Maintain Energy Management System |
AS AMER |
| 3 |
| 13 |
|
|
| 1 |
AS APAC |
| 4 |
| 5 |
| 1 |
| 4 |
AS DACH |
| 6 |
| 7 |
| 3 |
| 4 |
AS EMEA |
| 10 |
| 13 |
|
|
| 4 |
KWS |
| 2 |
| 7 |
|
|
| 2 |
Total |
| 25 |
| 45 |
| 4 |
| 15 |
% locations covered in reporting scope* |
| 24% |
| 44% |
| 4% |
| 15% |
% employees covered (based on FTEs) |
| 60% |
| 64% |
| 15% |
| 35% |
*Including offices
There have been no incidents of non-compliance with environmental laws or regulations in the financial year 2019/20.
Outlook
Despite the uncertainties brought by Covid-19, we will continue our efforts to achieve our environmental targets and to advance our global environmental activities. For example, we aim to set water use reduction targets together with the local management for those sites having (1.) high or extreme water stress, and (2.) high water consumption relative to other sites, in order to develop appropriate action plans. This also is part of our human rights roadmap in view of the right to clean water and sanitation. A large variety of other activities are planned including:
- AS AMER plans investment in more efficient heating system, a sustainable building certification for a new facility retrofitting to LED lighting and water savings mechanisms in sanitation areas.
- AS APAC will improve an air compressor control system and will implement a rooftop leasing project with a solar energy provider.
- AS DACH will establish LED lighting as a standard across the segment. In Germany, improvements will be made to HVAC system including installing more efficient water pumps and boilers, shutting off the air conditioning on the weekends, and equipping more energy-efficient air compressors with a heat recovery system that feeds into the general heating system.
- AS EMEA will continue its multi-year project to install a more efficient heating system for the manufacturing facility in Wetzikon (Switzerland), which will reduce their carbon emissions by 60%. A harmonized ISO 14001 management system will be implemented within the next two financial years for four large manufacturing facilities across the segment.
- Key & Wall Solutions expects to achieve five ISO 50001 and two ISO 14001 certifications across various facilities. Specific projects include the installation of: new solar panel systems at two facilities and an expansion of an existing solar panel system at another facility; evaporators to reduce liquid hazardous waste coming from nickeling and milling processes; new boilers and more efficient air compressors; and a heat recovery system for air compressors to reduce warming needs in the winter.
Moving from energy consumer to energy producer
An interview with William Lee, Senior Manager Operations, dormakaba Movable Walls APAC
With your solar power plant installation in Senai (Malaysia), you are the third manufacturing facility in dormakaba to make the shift from energy consumer to energy producer. What motivated you and your management team to do this?
In line with our commitment towards sustainable development, our team at Senai set increased focus on environmental projects for the financial year 2019/20. We landed on the idea of a solar power system because the positive impact on the environment is great in terms of carbon emissions reduction, and at the same time reduces our electricity bill. We also realized that we were eligible for some local government programs that support this kind of investment with tax incentives.
What were the most surprising or challenging things that you had to consider in the panel selection, installation and maintenance process?
Everything was a challenge! This was because we had to learn everything about how such systems work, from top to bottom. It was very new for everyone, and very technical. We set up a project committee and conducted a study on the different types of panels available, ran cost comparisons and scenarios on system reliability. During the installation phase, the challenging part was ensuring the safety of the installers because we were ten meters up on our roof.
How have you set up the system? For example, are you still connected to the local power grid and are you able to sell your surplus electricity to the local utility company for credits? Is the system reliable even on cloudy or rainy days?
This system has a dual meter, meaning we can sell the excess energy back to the utility company. The monthly electricity bill has the import & export figures. The system still produces energy on rainy and cloudy days but just not as much as on sunny days. We can monitor the system 24/7 via a mobile app, which shows the energy produced and whether there are any technical faults.
Looking forward, what is the one biggest piece of advice that you would like to share with others that are considering similar installations?
I would highly recommend this system to all our EHS colleagues and other companies. This project brings enormous benefits, both for the environment and for our profitability, with an expected return on investment in three and a half years. We have already seen a 45% drop in our electricity bills, too. This system can be used for 25 years – the main maintenance work is cleaning the PV Module, which we contract out for a very minimal annual fee. We even negotiated to have this done free of charge for three years. I do not see any reason not to install one.